9 National Inequality
9.1 Rationale, Approach and implementation
Rationale: Scientific basis for the analysis
Household surveys provide critical information on inequalities. Our focus is on three major dimensions of inequality: area of residence, wealth and education.
For area of residence, we focus on urban/rural areas, for wealth, we use household wealth quintiles and for education we focus on education of the mother. Equiplots are used to assess whether the country has made progress since 2010 in reducing the poor rich gap or the gap between women with no education or low education and women with higher education.
For wealth quintiles, it can be assessed what the type of inequality is, as all categories are of the same size:
- If the richest are well ahead of all other wealth quintiles, this is top inequality and is sometimes also referred to as mass deprivation (only the rich escape)
- If the coverage differences are equidistant, this is a linear pattern where the increasing household wealth is linearly associated with higher coverage
- If the poorest are left behind, this is called bottom inequality, and means marginalization of the poorest. Each pattern requires a different strategy of health programming and targeting.
9.2 Interpretation of equiplots
The interpretation should focus on whether inequalities have reduced over time and to what extent global targets for coverage have been met. Consider your audience/s and what key messages and insights you want to get across.
The following questions should guide and be answered by the interpretation:
- What is the level of inequality in the most recent data point?
- How have inequalities changed over time?
- Is there any inequality pattern that can be observed?
- What will be the best approaches to reduce inequalities?
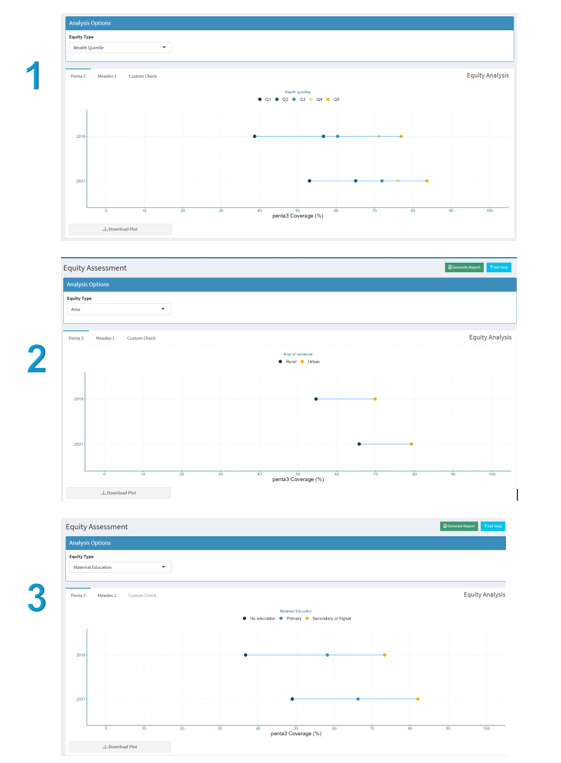
Implementation: Conducting analysis in the Shiny App
This will be analysed within the National analyses ->Equity Assessment section in the Shiny App
You expect to see output as below