20 Health systems outputs by inputs
20.1 Health systems outputs by inputs at the subnational level
The second part of the analysis explores the association between health system inputs and service utilization and coverage by sub-national units (admin1).
The following can be examined:
- Association between hospital density (per 100,000) and admission rates for children under 5 and beds per 10,000 population and admission rates for children under 5, by admin1.
-
We expect that regions with lower hospital density have lower admission rates for children, and those with higher density have higher admission rates. This would show as a positive slope of a linear regression line, as below.
Insert screenshot (6-ipd_use)
-
There may be major outliers. For instance, regions with low density and high admission rates: this may be because:
Hospital density is under-reported by these regions
Hospitals in the low density regions have very high admission and bed occupancy rates
Hospital admission are over-reported in these regions.
The interpretation should be based on knowledge of the actual situation in the regions.
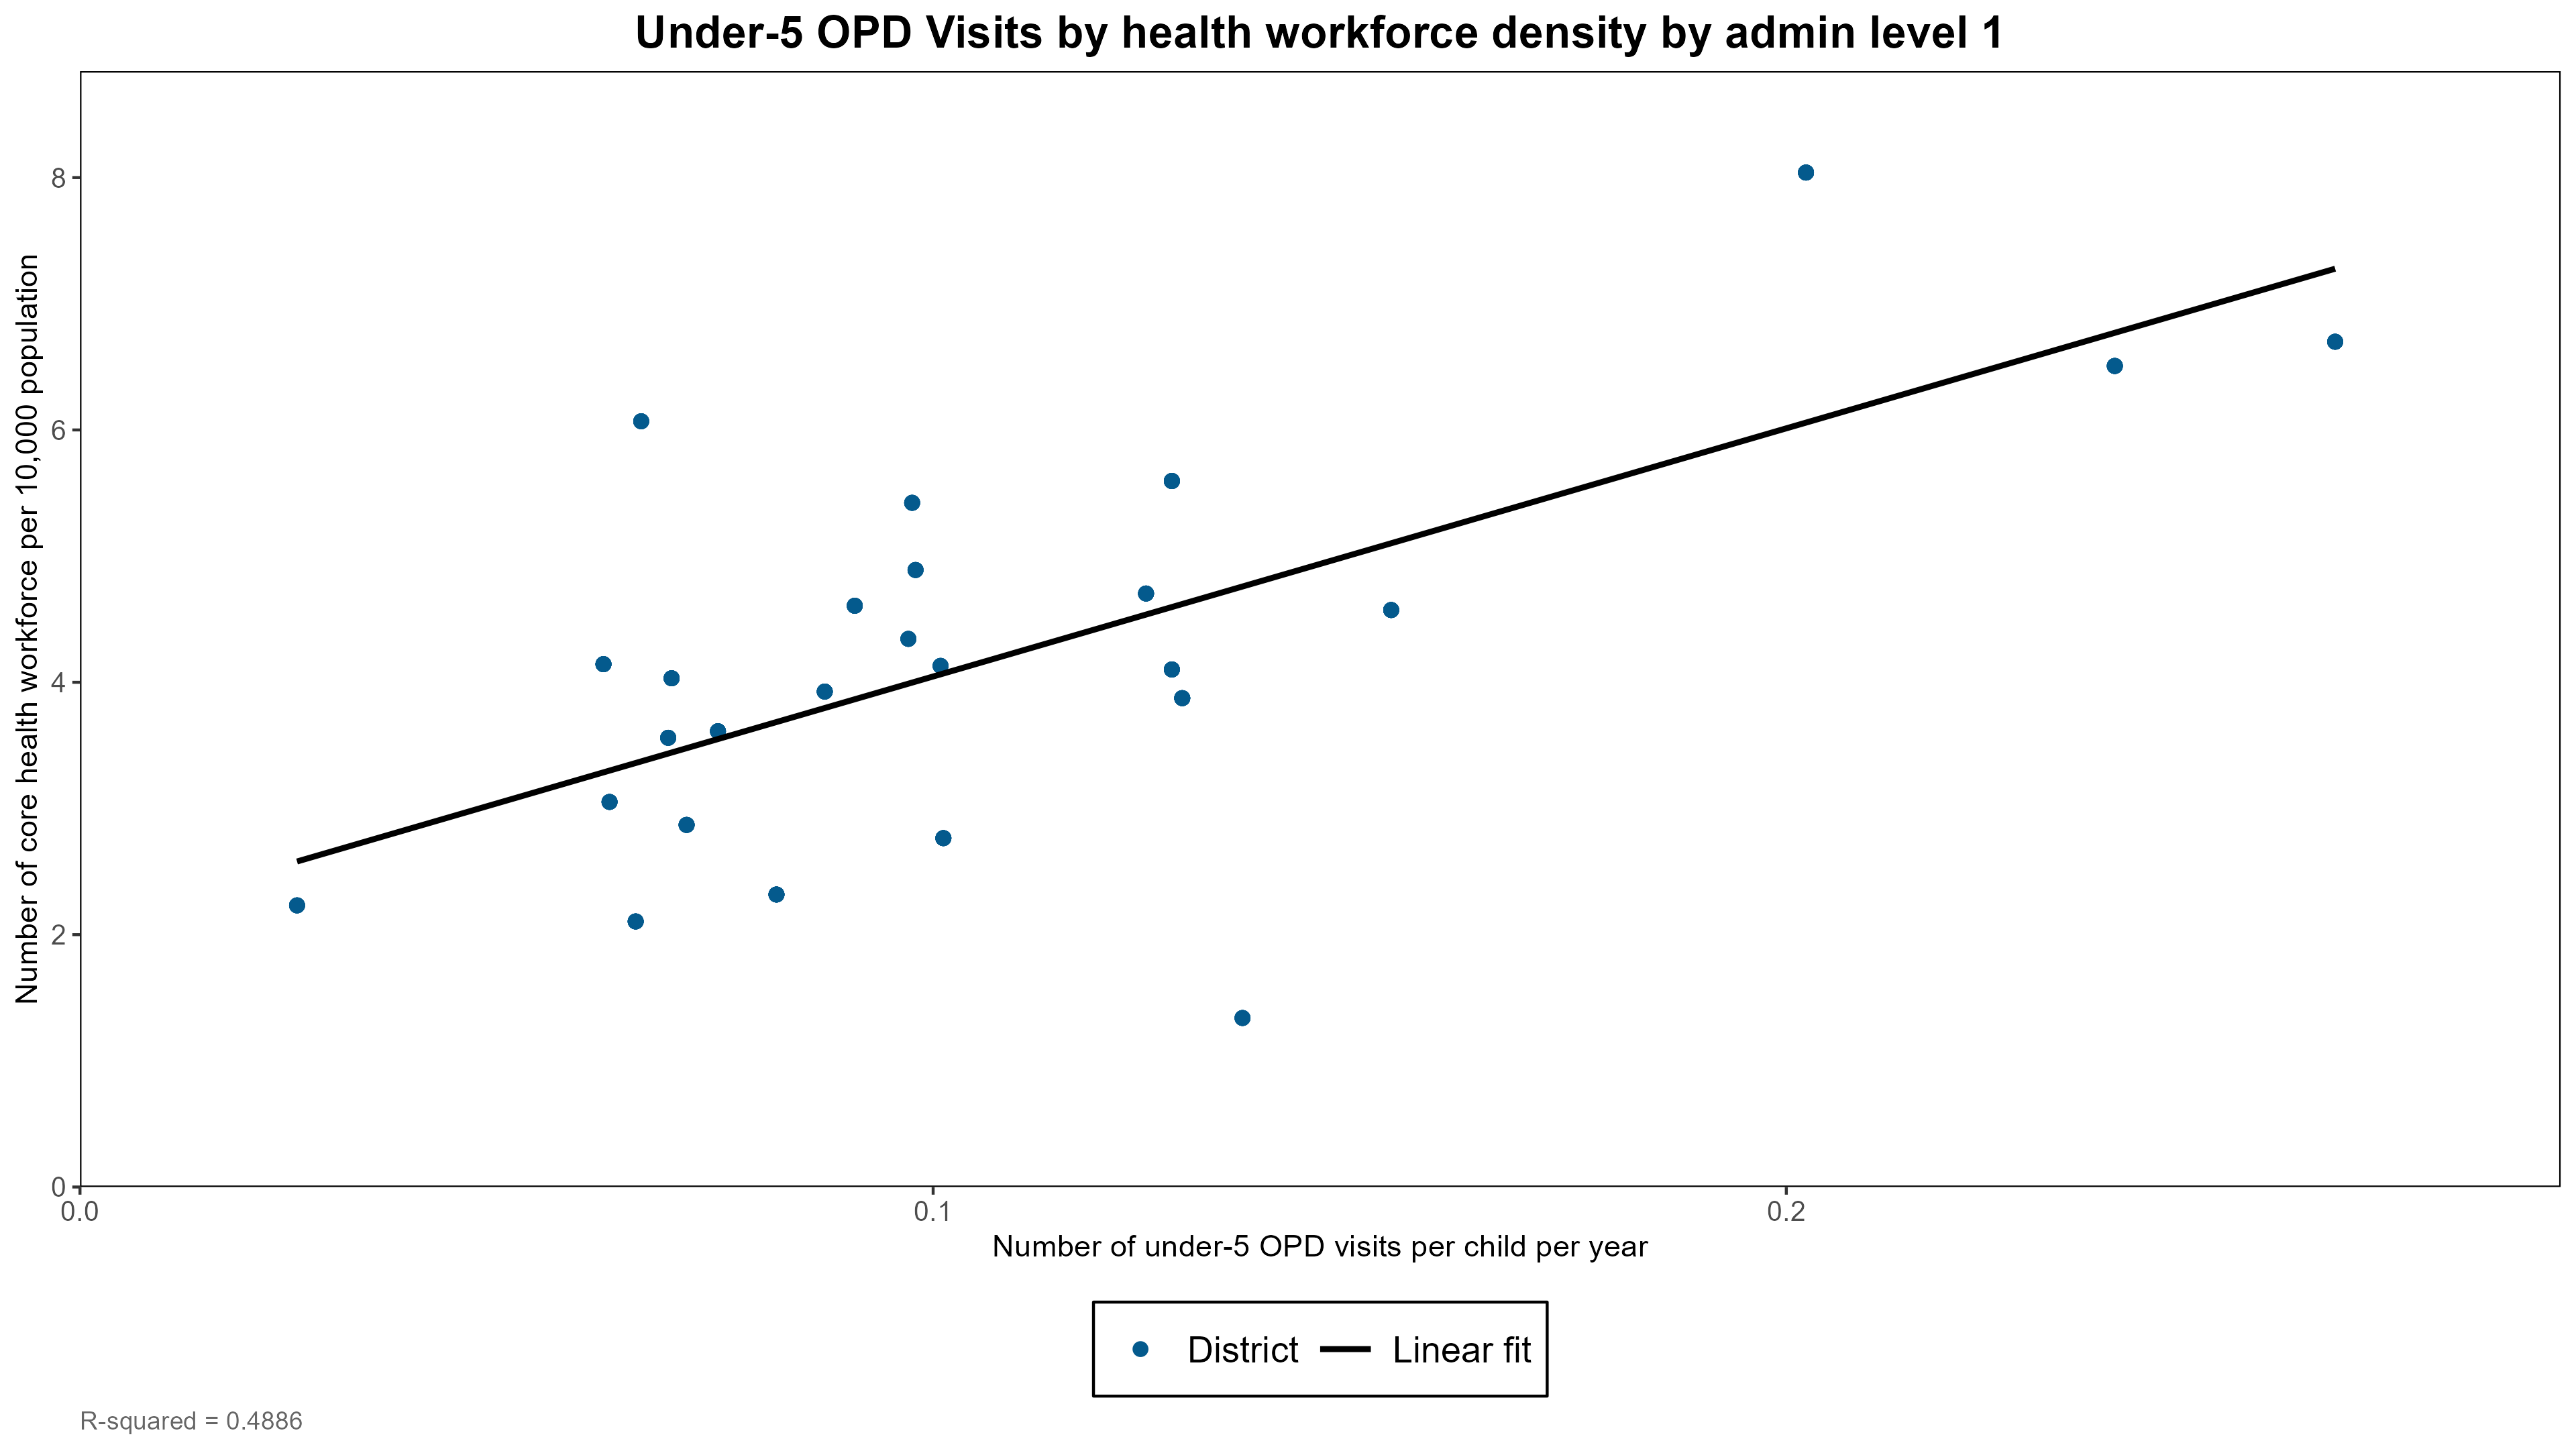
- Association between health workforce (core health professionals per 10,000) and outpatient visits among children under 5, by region
- We expect that regions with lower health workforce density have lower OPD utilization rates for children, and those with higher density have higher admission rates. This would show as a positive slope of a linear regression line, as in the figure below.
-
There may be major outliers, for instance, regions with low health workforce density and high OPD utilization rates. This may be because:
Health workforce density is under-reported by these regions
Health workers have a very high workload in these regions
Health workforce density is over-reported in these regions (less likely).
The interpretation should be based on knowledge of the actual situation in the regions.
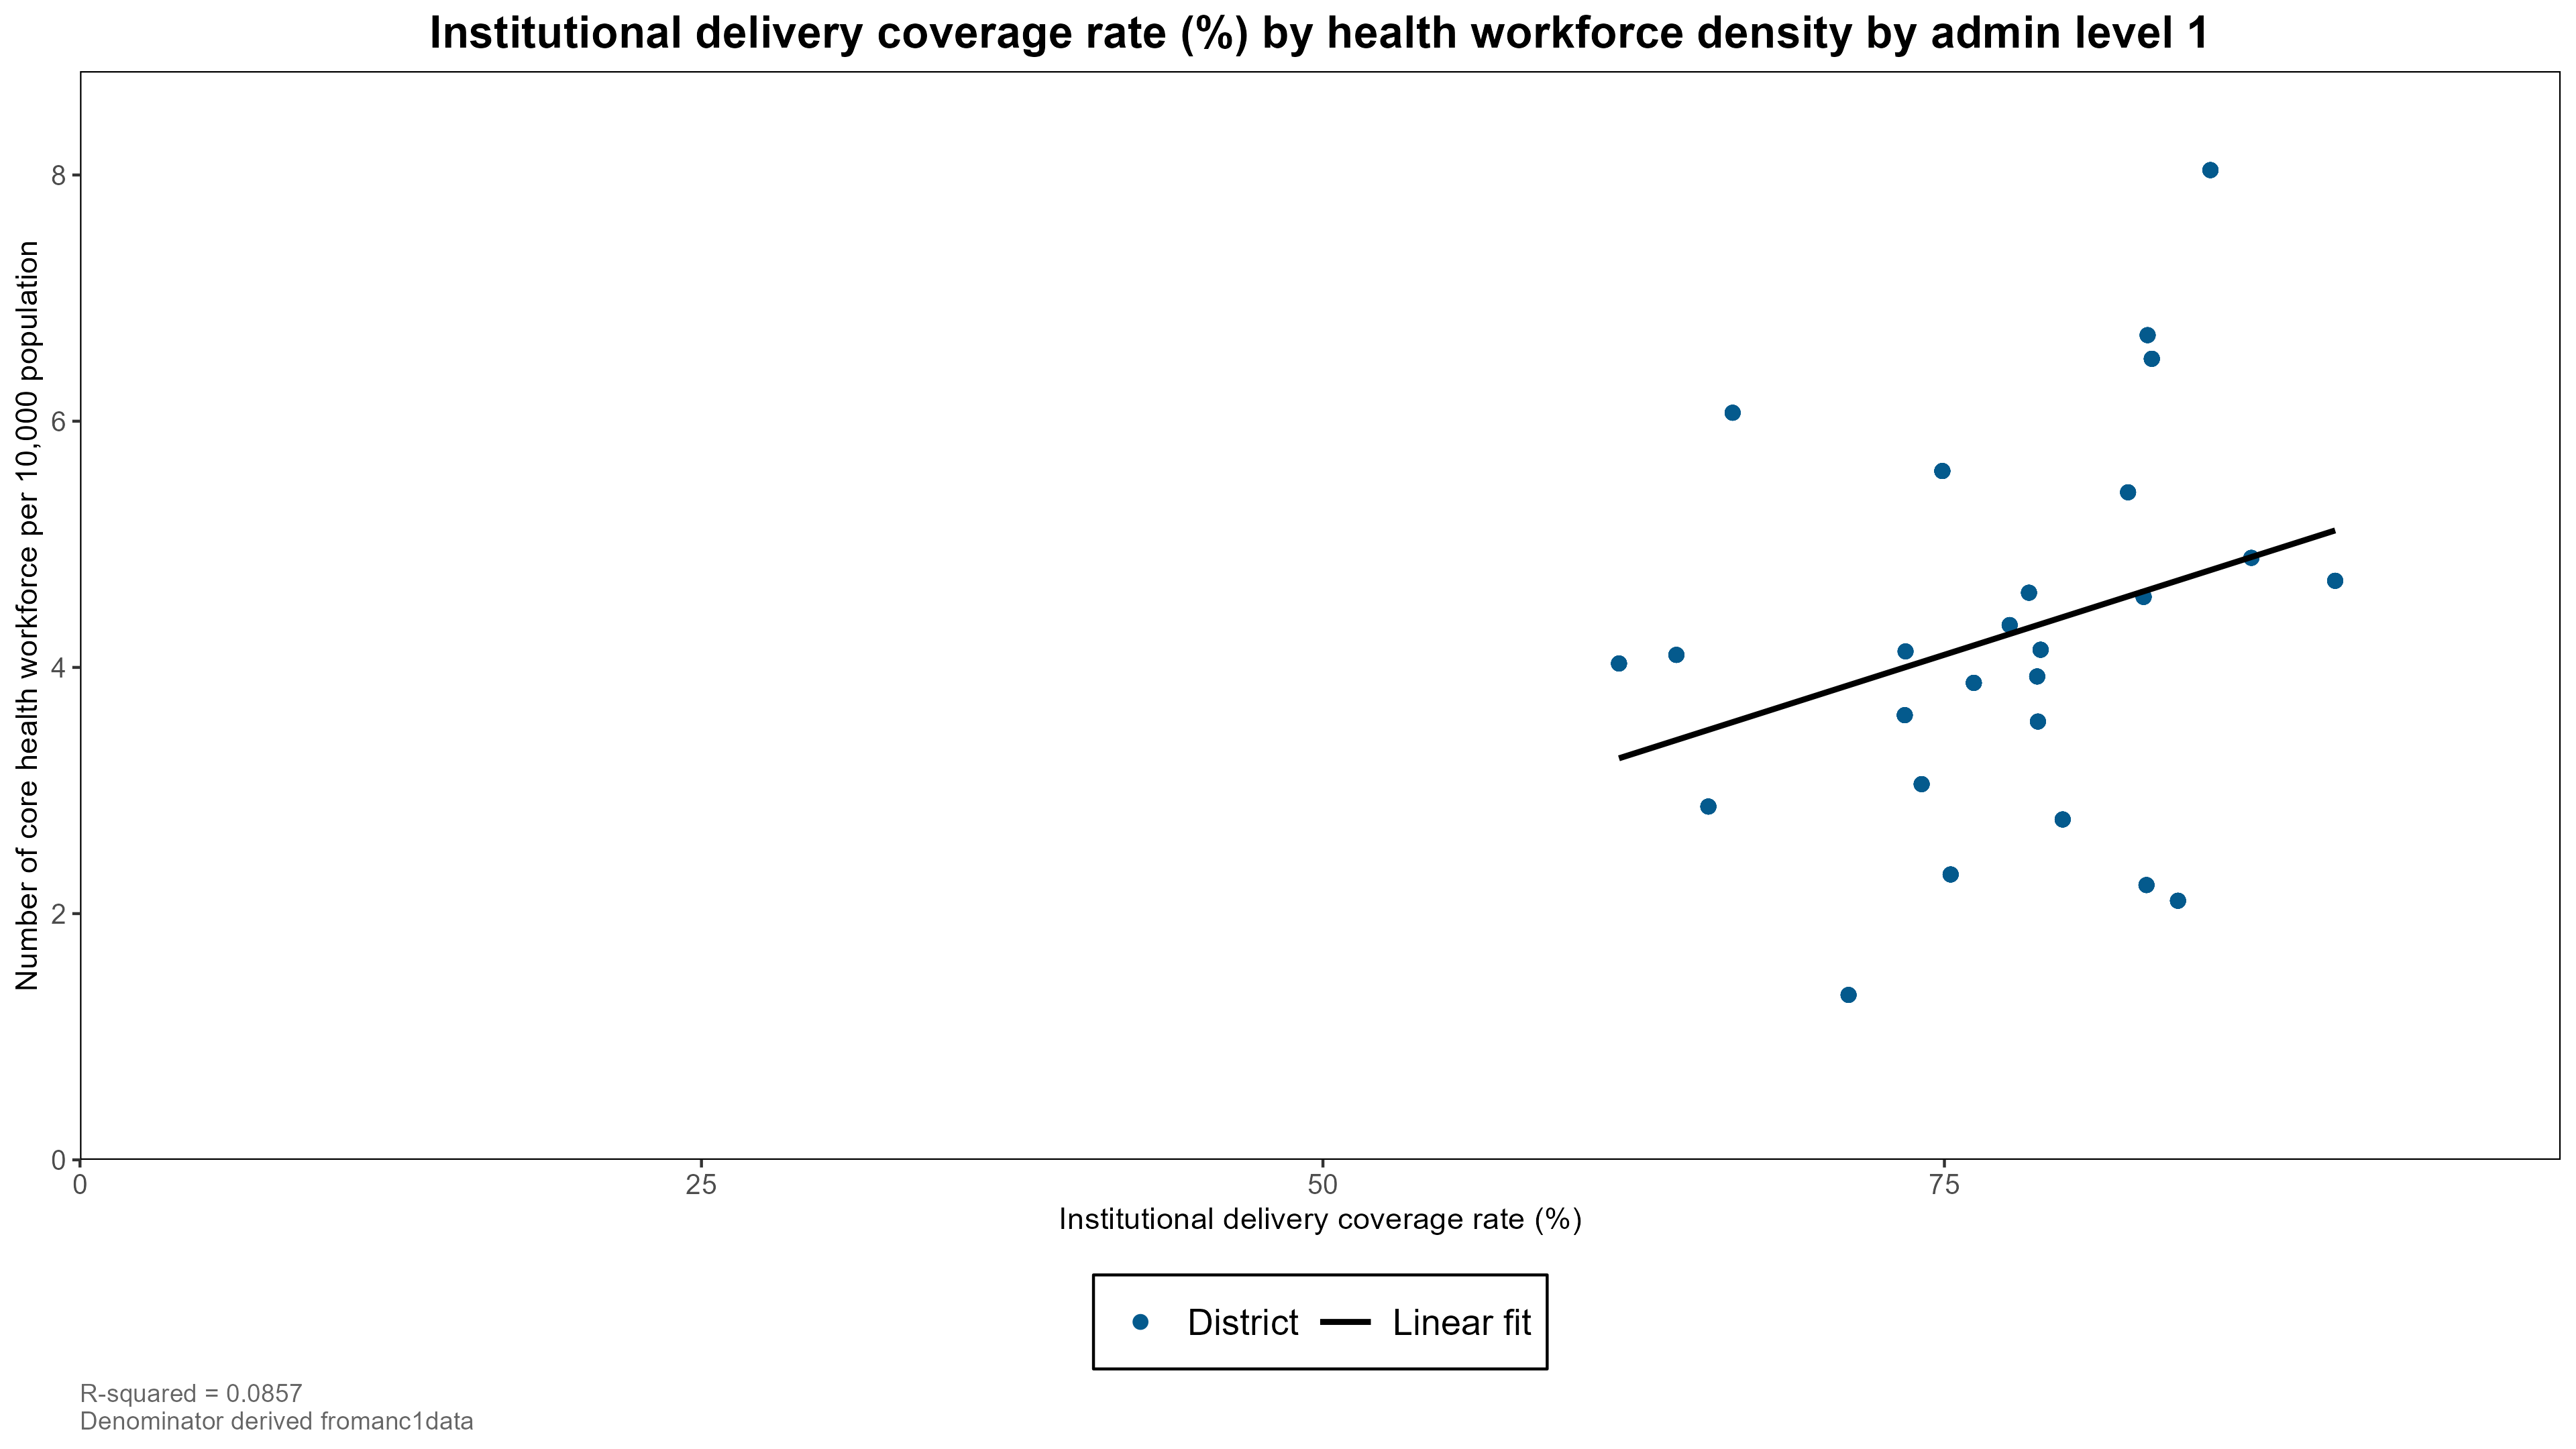
- Association between health workforce (core health professionals per 10,000) and institutional live birth coverage, by region
For delivery coverage, data by region from either a recent household survey or the most recent DHIS2 data derived estimate can be used.
-
We expect that regions with lower health workforce density have lower institutional delivery rates for children, and those with higher density have higher rates. This would show as the positive slope of a linear regression line.
The considerations for the interpretation are the same as above.
{r, out.width = “100%”, fig.align = “center”, echo=F} knitr::include_graphics(here::here(“images”,“8-health_system_ratio_opd_u5_hwf.png”))