13 Coverage
14 Sub-national Coverage
14.1 Rationale, Approach and implementation
Rationale: Scientific basis for the analysis
Sub-national analysis of health intervention coverage is essential for advancing universal health coverage (UHC), which aims to ensure equitable access to quality health services for all populations. National averages often mask critical disparities that exist across regions, districts, or population subgroups.
Monitoring sub-national data helps identify geographical areas where coverage is low, signaling potential inequities in health service access and prompting targeted interventions. This is particularly important for drawing attention to populations who are left behind and ensuring resources are directed where they are most needed.
Approach: Description of analytical steps
The focus here is to assess the coverage estimates (e.g., ANC4, institutional deliveries, Penta3) at Admin1 and Admin2 levels using the best performing denominator for the coverage computations, as decided from the analysis in section 2 on denominators.
There will be more “noise” in the sub-national data with improbably high or low coverage rates, compared to the national analyses, and more so in the district analyses than in the regional (admin1) analyses. This is because district analyses are affected by small numbers (more fluctuations which may be random or due to data quality issues) and by the health service utilization patterns by women and children. For instance, a municipal district may get more deliveries than an adjacent rural district because of the location of the hospitals in the municipal district.
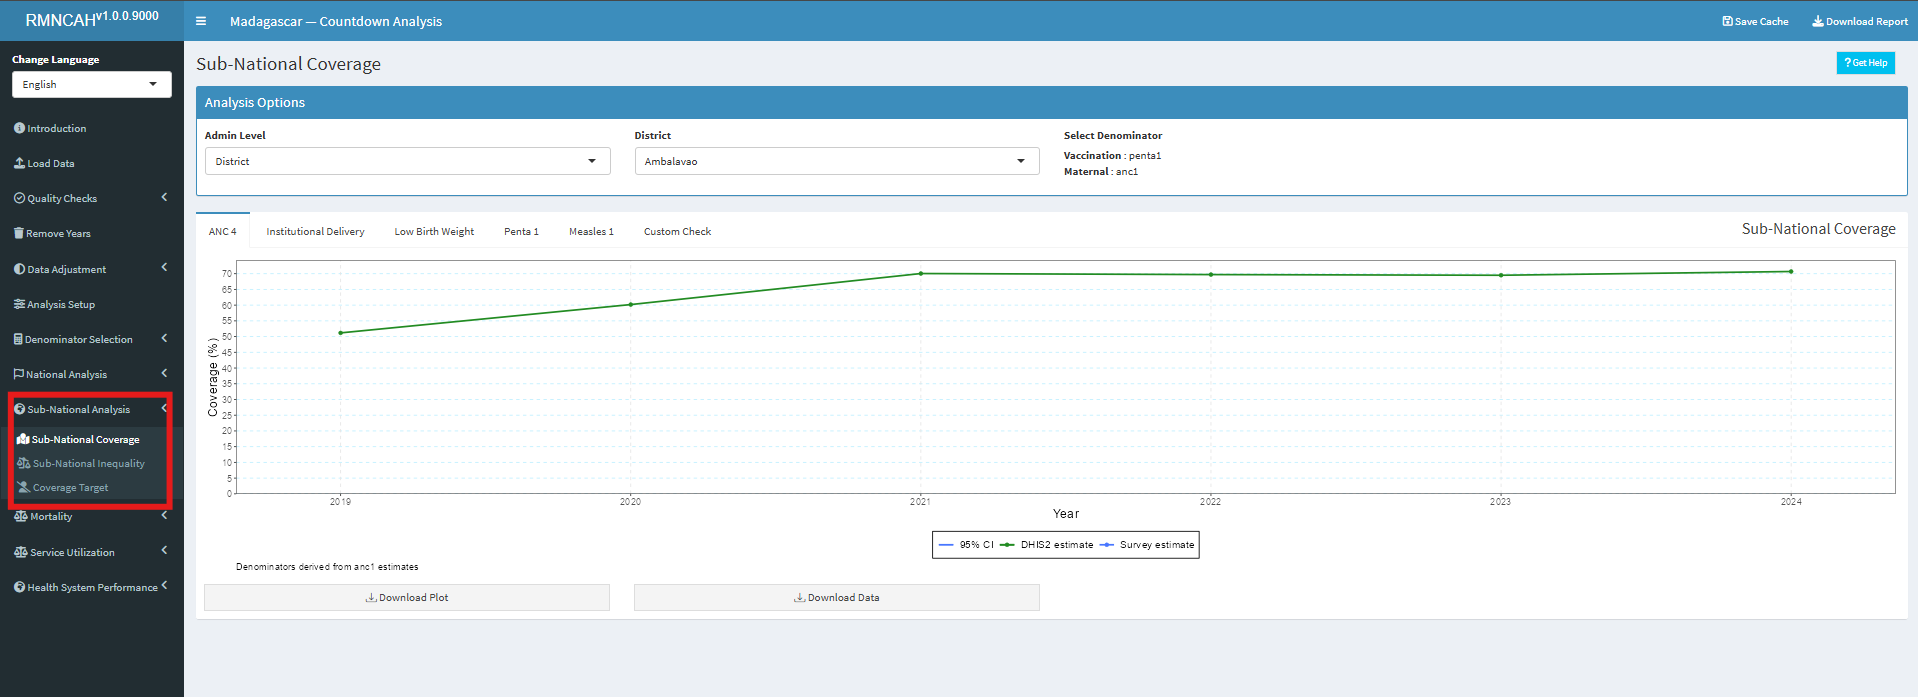
Implementation: Conducting analysis in the Shiny App
Navigate to the Subnational Analysis tab ->Subnational Coverage and select the admin level of interest (Region (Admin Level1) or District. Then select the indicator of interest from the key indicators (ANC4, Institutional deliveries, Low Birth Weight, Penta 1 and Measles 1. You can also use the Custom Check tab to select any other indicator of interest.
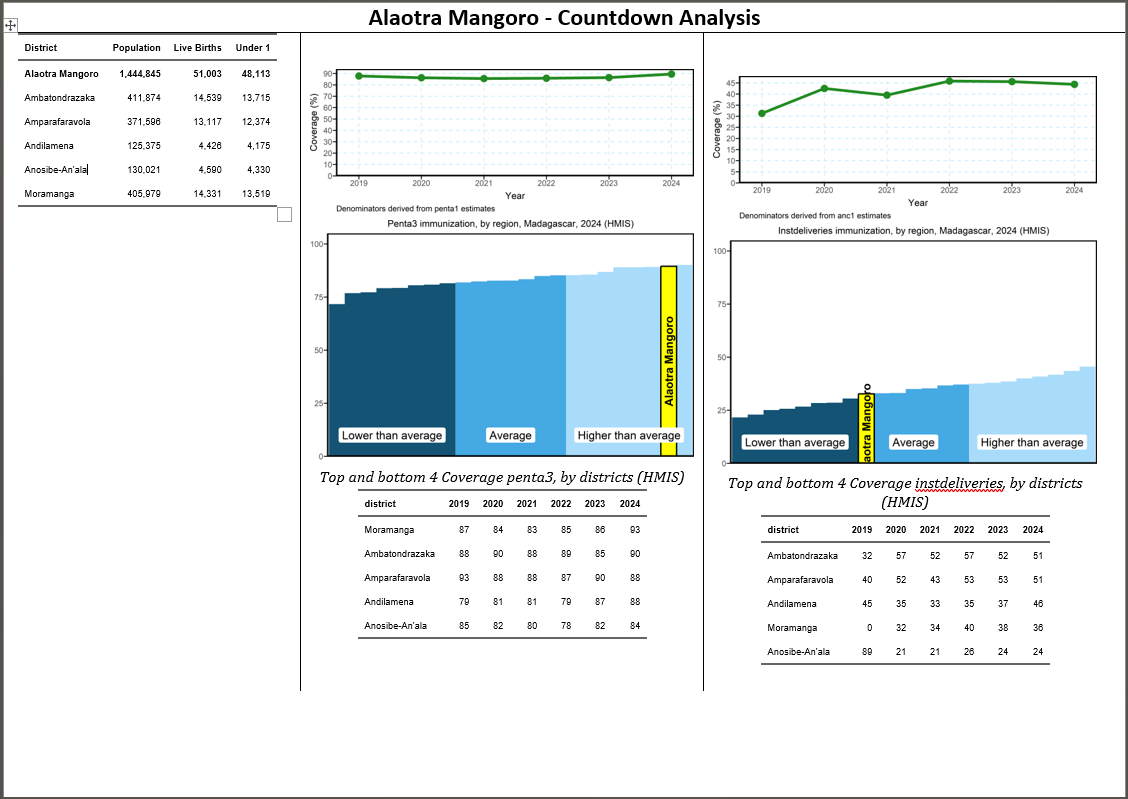
14.2 Sub-national statistical summaries (One pager)
The aim is to produce a one-pager for each admin1 unit (generally region, province or county) that contains the regional information as well as a summary of the districts within the region. We refer to this as the regional sub-national statistical summary.
The following components are included:
- Summary of key demographic information for the region and the districts: table with expected number of births in 2024 according to the DHIS2 projections and according to the preferred denominators derived from the health facility data (based on ANC1 for live births, and on penta1 for immunization indicators).
- Line graphs with the trend in coverage of institutional deliveries and penta3 vaccination that include the best estimates for 2020-2024 based on the health facility data, as well as the estimates from the most recent surveys (from 2015) for the same indicators (with confidence intervals if possible).
- Bar graphs that compare the 2024 coverage situation in the region compared to all other regions, and puts the region into the lowest, middle or upper third of regions in terms of coverage. This is done for both institutional deliveries and penta3 vaccination.
- Table that summarizes the coverage for institutional deliveries and penta3 vaccination in 2024 by district.
- Other indicators can be used as prioritized by the country (e.g., ANC4, measles1).
To summarize the coverage situation according to the health facility statistics for 2024 can be done for the regional level and shown on a map. A composite coverage index is computed as an average in seven mother and child health indicators: ANC4, institutional live birth coverage, SBA, IPT2, postnatal care, pentavalent vaccine 3rd dosage and measles 1 vaccination coverage. Equal weight is given to all indicators.