6 Numerator adjustments
6.1 Rationale, Approach and implementation
Rationale: Scientific basis for the analysis
The completeness of reporting may affect the analysis, especially if completeness is low or varies between years. Extreme outliers, such as an accidental extra zero in a number, can have a large impact, especially on subnational numbers. Following the assessments, several steps are necessary to obtain a clean data set for analysis. This implies adjusting for incomplete reporting and correcting for extreme outliers.
Approach: Description of analytical steps
If we do not consider reporting completeness that means we assume all non-reporting facilities provided zero services, which is not likely to be true. Adjustments depend on how much services (e.g., pregnancy care, vaccinations) were provided at non-reporting facilities compared to those that reported. The adjustment factor k - defined as the ratio of the volume of services provided by non-reporting facilities to the volume of services provided by reporting facilities - is used to adjust the reported numbers for incomplete reporting.
6.2 Numerator Adjustment
To account for incomplete reporting, the reported number of events can be adjusted using completeness and facility reporting ratio, with the following formula:
\[ N_{\text{adjusted}} = N_{\text{reported}} + N_{\text{reported}} \times \left( \frac{1}{c} - 1 \right) \times k \]
Where:
- \(N_{\text{adjusted}}\): Total number of events adjusted for incomplete reporting
- \(N_{\text{reported}}\): Number of events reported
- \(( c )\): Reporting completeness (e.g., proportion of facilities that reported)
- \(( k )\): Adjustment factor to account for lower service volume in non-reporting facilities
As a default value, we use \(k=0.25\) , which means the non-reporting facilities provided services but only at a volume which was a quarter of the reporting health facilities.
The factor k can be different for different services. For instance, if private facility reporting is poor but they are in the national system and they provide a considerable number of deliveries, k maybe greater than 0.25 or even as high as 1.0.
The following k-values are used depending on the reporting used to adjust the reported numbers for incomplete reporting:
- \(k=0\) - No services in non-reporting facilities (default k-value)
- \(k=0.25\) - Some services, but much lower than reporting facilities
- \(k=0.50\) - Half the rate compared to reporting facilities
- \(k=0.75\) - Nearly as much as reporting facilities
- \(k= 1.0\) - Same rate of services as reporting facilities
If the facility reporting rate is below 75%, it becomes more difficult to impute district data. Therefore, no adjustments are made if reporting is lower than 75%. In that case, further analysis to determine coverage with the facility data is not considered sufficiently reliable.
Extreme outliers, as defined in the previous section, will be corrected by imputing the median monthly value of the same year. The table summarizes the adjustments.
Table 2: Summary of adjustments made to the raw health facility data in preparation of a clean data set for the endline analysis
| Problem | Action | Adjustment |
|---|---|---|
| Low reporting rates: identifying low rates that were adjusted | If below 75% (default), data were imputed | Median monthly value for the district year was imputed for the month with low reporting |
| Incomplete reporting by districts, variable over time, affecting trend assessment | If reporting rates were >=75% and <= 100% default), an assumption was made about the volume of services provided by the non-reporting facilities | Adjustment factor k value was used to adjust for incomplete reporting k default value 0.25 (replace if different value used; state if used for all reporting forms or different k factors between forms) |
| Extreme outliers can greatly affect coverage trend assessments | If a monthly value was greater or smaller than 5 times the median absolute deviation (MAD) from district monthly median value, an adjustment was made | Extreme monthly outliers are corrected and given the district median value for the same year |
| Missing values | If there is a missing value, data were imputed | District median monthly value for the year was imputed for the month with missing value |
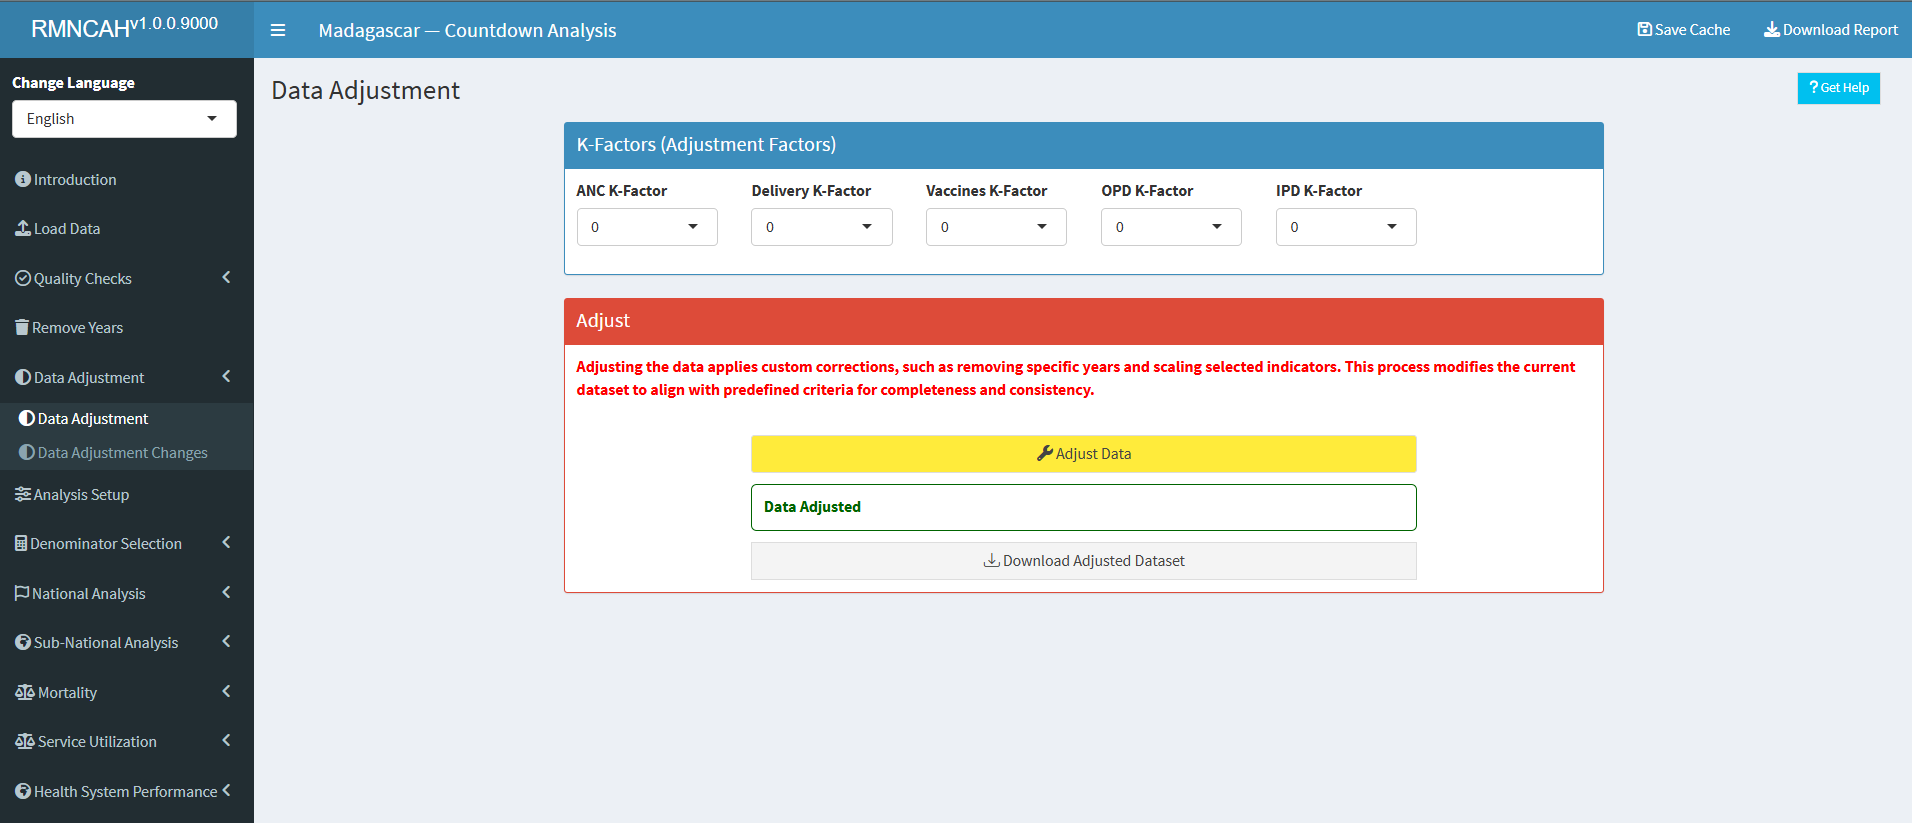
6.3 Implementation: Conducting analysis in the Shiny App
The outputs for this analysis can be obtained through the Data adjustment section of the Shiny App.
-
Select the \(k-factor\) that is deemed appropriate given your country context.
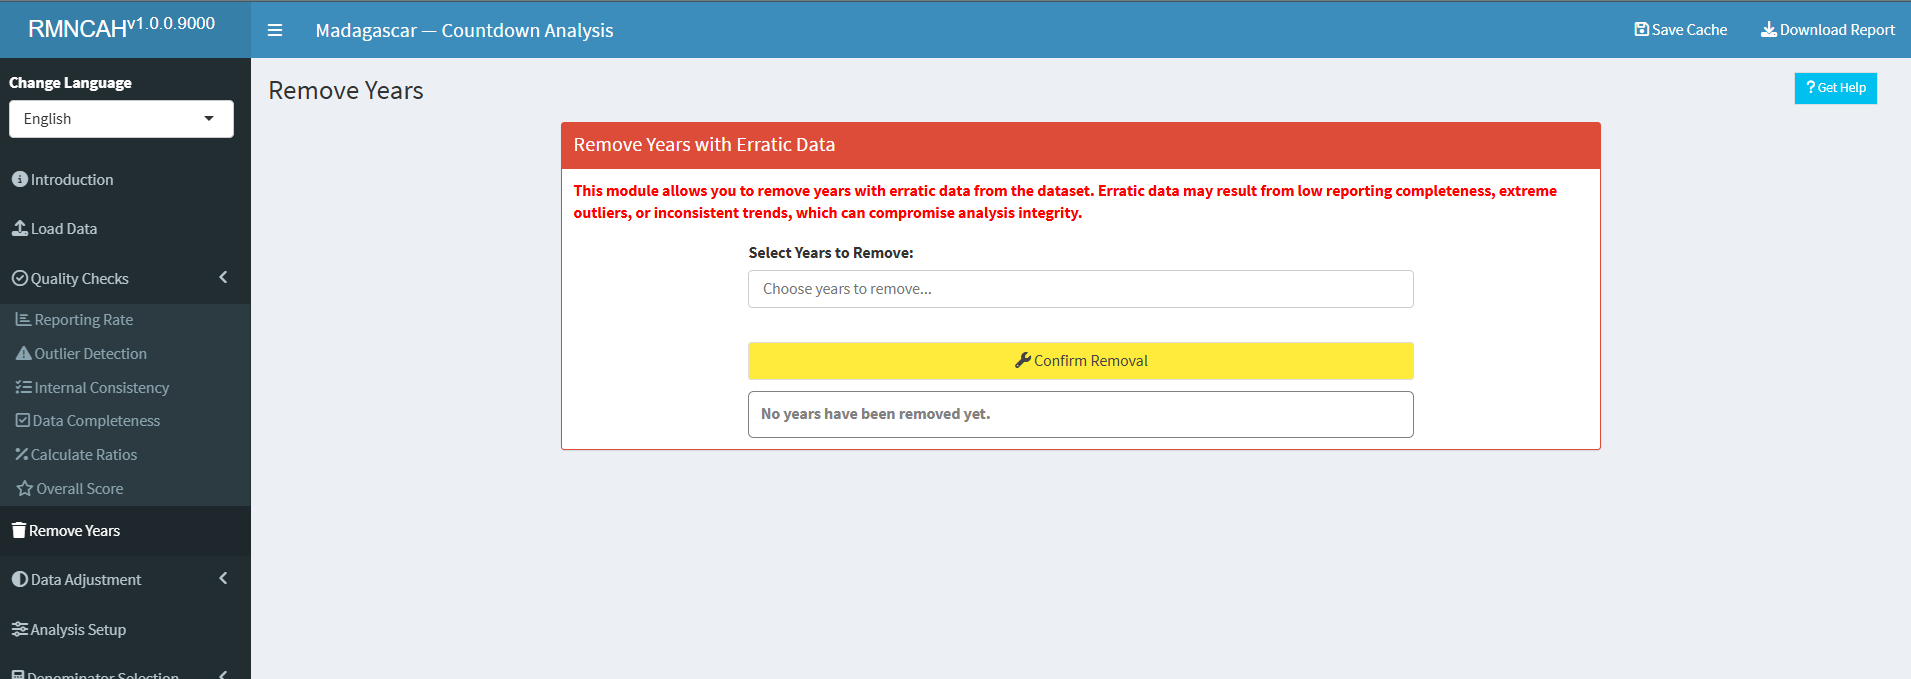
6.3.1 Remove Years
The Remove Years section allows you to remove any years with no data or whose data has been determined to not be fit for analysis by the country team due to quality issues.
It is recommended to be used in instances where the data quality is poor, or the country teams have sufficient, contextual information that renders the said year(s)’ data unreliable/inaccurate.This will ensure that the analysis is based on reliable data.
6.3.2 Adjustment outputs
-
This Section produces a master adjusted dataset
(.dta)ready for analysis and plots for different indicators showing data adjustment changes. In the image below, we can see the adjustment output after making no adjustment to the data \((k=0)\).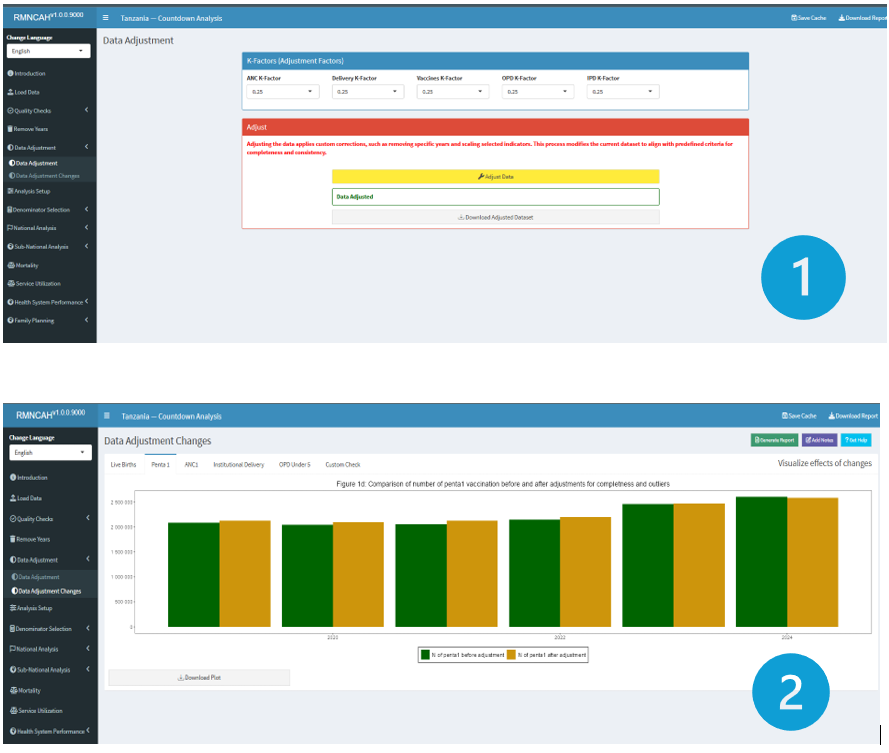
6.3.3 Report
- The interpretation should include the selected adjustment factor (factor k) that was used to adjust for incomplete reporting (if necessary, by service). If the default factor is used, then report this and explain what this means for the reader.
- Report the percent change that the adjustment made in reported numbers of institutional deliveries and in penta1 (average of the 6-year period);
- You may want to :
- Highlight the year with the greatest impact of the adjustment if there is one;
- Interpret if the impact of the adjustment on coverage rates is large or small;
- Make the same description and interpretations for penta1 vaccinations.