16 Institutional Mortality
16.1 Rationale, Approach and implementation
Rationale: Scientific basis for the analysis
Maternal and perinatal mortality in health facilities are critical indicators of the quality of care (institutional mortality). Institutional maternal mortality is one of the key indicators proposed to monitor progress. Facility-based mortality statistics can also be a critical input into the estimation of population levels of mortality.
Reporting of maternal deaths, stillbirths, and early neonatal deaths (before discharge) may occur through the routine reporting system (DHIS2, aggregate or individual level) or be part of a maternal and perinatal death surveillance and response system (MPDSR).
Population mortality statistics (maternal mortality ratio, stillbirth rates, neonatal mortality rates) rely on household surveys and censuses, with major limitations, especially for maternal mortality and stillbirths. A promising development is the major increase in health facility deliveries observed in many countries.
Especially if coverage of births in health facilities is high (e.g., over 75%), the facility-based statistics will become a useful input into the estimation of population levels of mortality. The main challenge with mortality data from health facilities is under-reporting of deaths. Maternal deaths do not only occur during birth, but also in pregnancy and post-partum.
Reporting of stillbirth deaths requires well maintained maternity registers, but also cross-checks to the operation theatre registers for cases of Caesarean section. If that is not the case, deaths may not be recorded in the maternity register, and not reported into the national system. In addition, maternal deaths occurring in other hospital wards are more likely to be missed, such as deaths associated with abortion, or post-discharge due to sepsis and other causes. Neonatal deaths after discharge, which is often within 24 hours, are also more likely to be missed.
A critical step is a systematic assessment of data quality issues, which forms the basis for, if possible, adjustments, and more importantly should guide efforts to improve reporting quality.
Approach: Description of analytical steps
The definitions for institutional, community and population maternal mortality and for stillbirths are:
| Indicator | Numerator | Denominator |
|---|---|---|
| Institutional maternal mortality ratio (iMMR) | Number of maternal deaths in health facilities1 | Number of live births in health facilities * 100,000 |
| Population maternal mortality (MMR) | Number of maternal deaths in the population | Number of live births in the population * 100,000 |
| Community maternal mortality ratio (comer) | Number of maternal deaths in the community | Number of live births in the community * 100,000 |
| Institutional stillbirth rate (iSBR) | Number of stillbirths in health facilities2 | Number of births in health facilities * 1,000 |
| Population stillbirth rate (SBR) | Number of stillbirths in the population | Number of births in the population * 1,000 |
| Community stillbirth rate (cSBR) | Number of stillbirths in the community | Number of births in the community * 1,000 |
| Neonatal mortality (before discharge) | Number of neonatal deaths before discharge | Number of live births in health facilities * 1000 |
16.2 Data Analysis Components:
Data analysis has the following components:
iMMR and iSBR review
The annual mortality rates are computed using the unadjusted data on reported deaths and births/live births in health facilities. We do not adjust for reporting rates and outliers (as is done for other interventions) because it is difficult to adjust maternal deaths and stillbirths, where the number of deaths is small and fluctuating.3 It is however advisable to check the data for any extreme outliers in the annual data (e.g., numbers of deaths that clearly indicate data entry errors) and replace these with the average of the surrounding years.
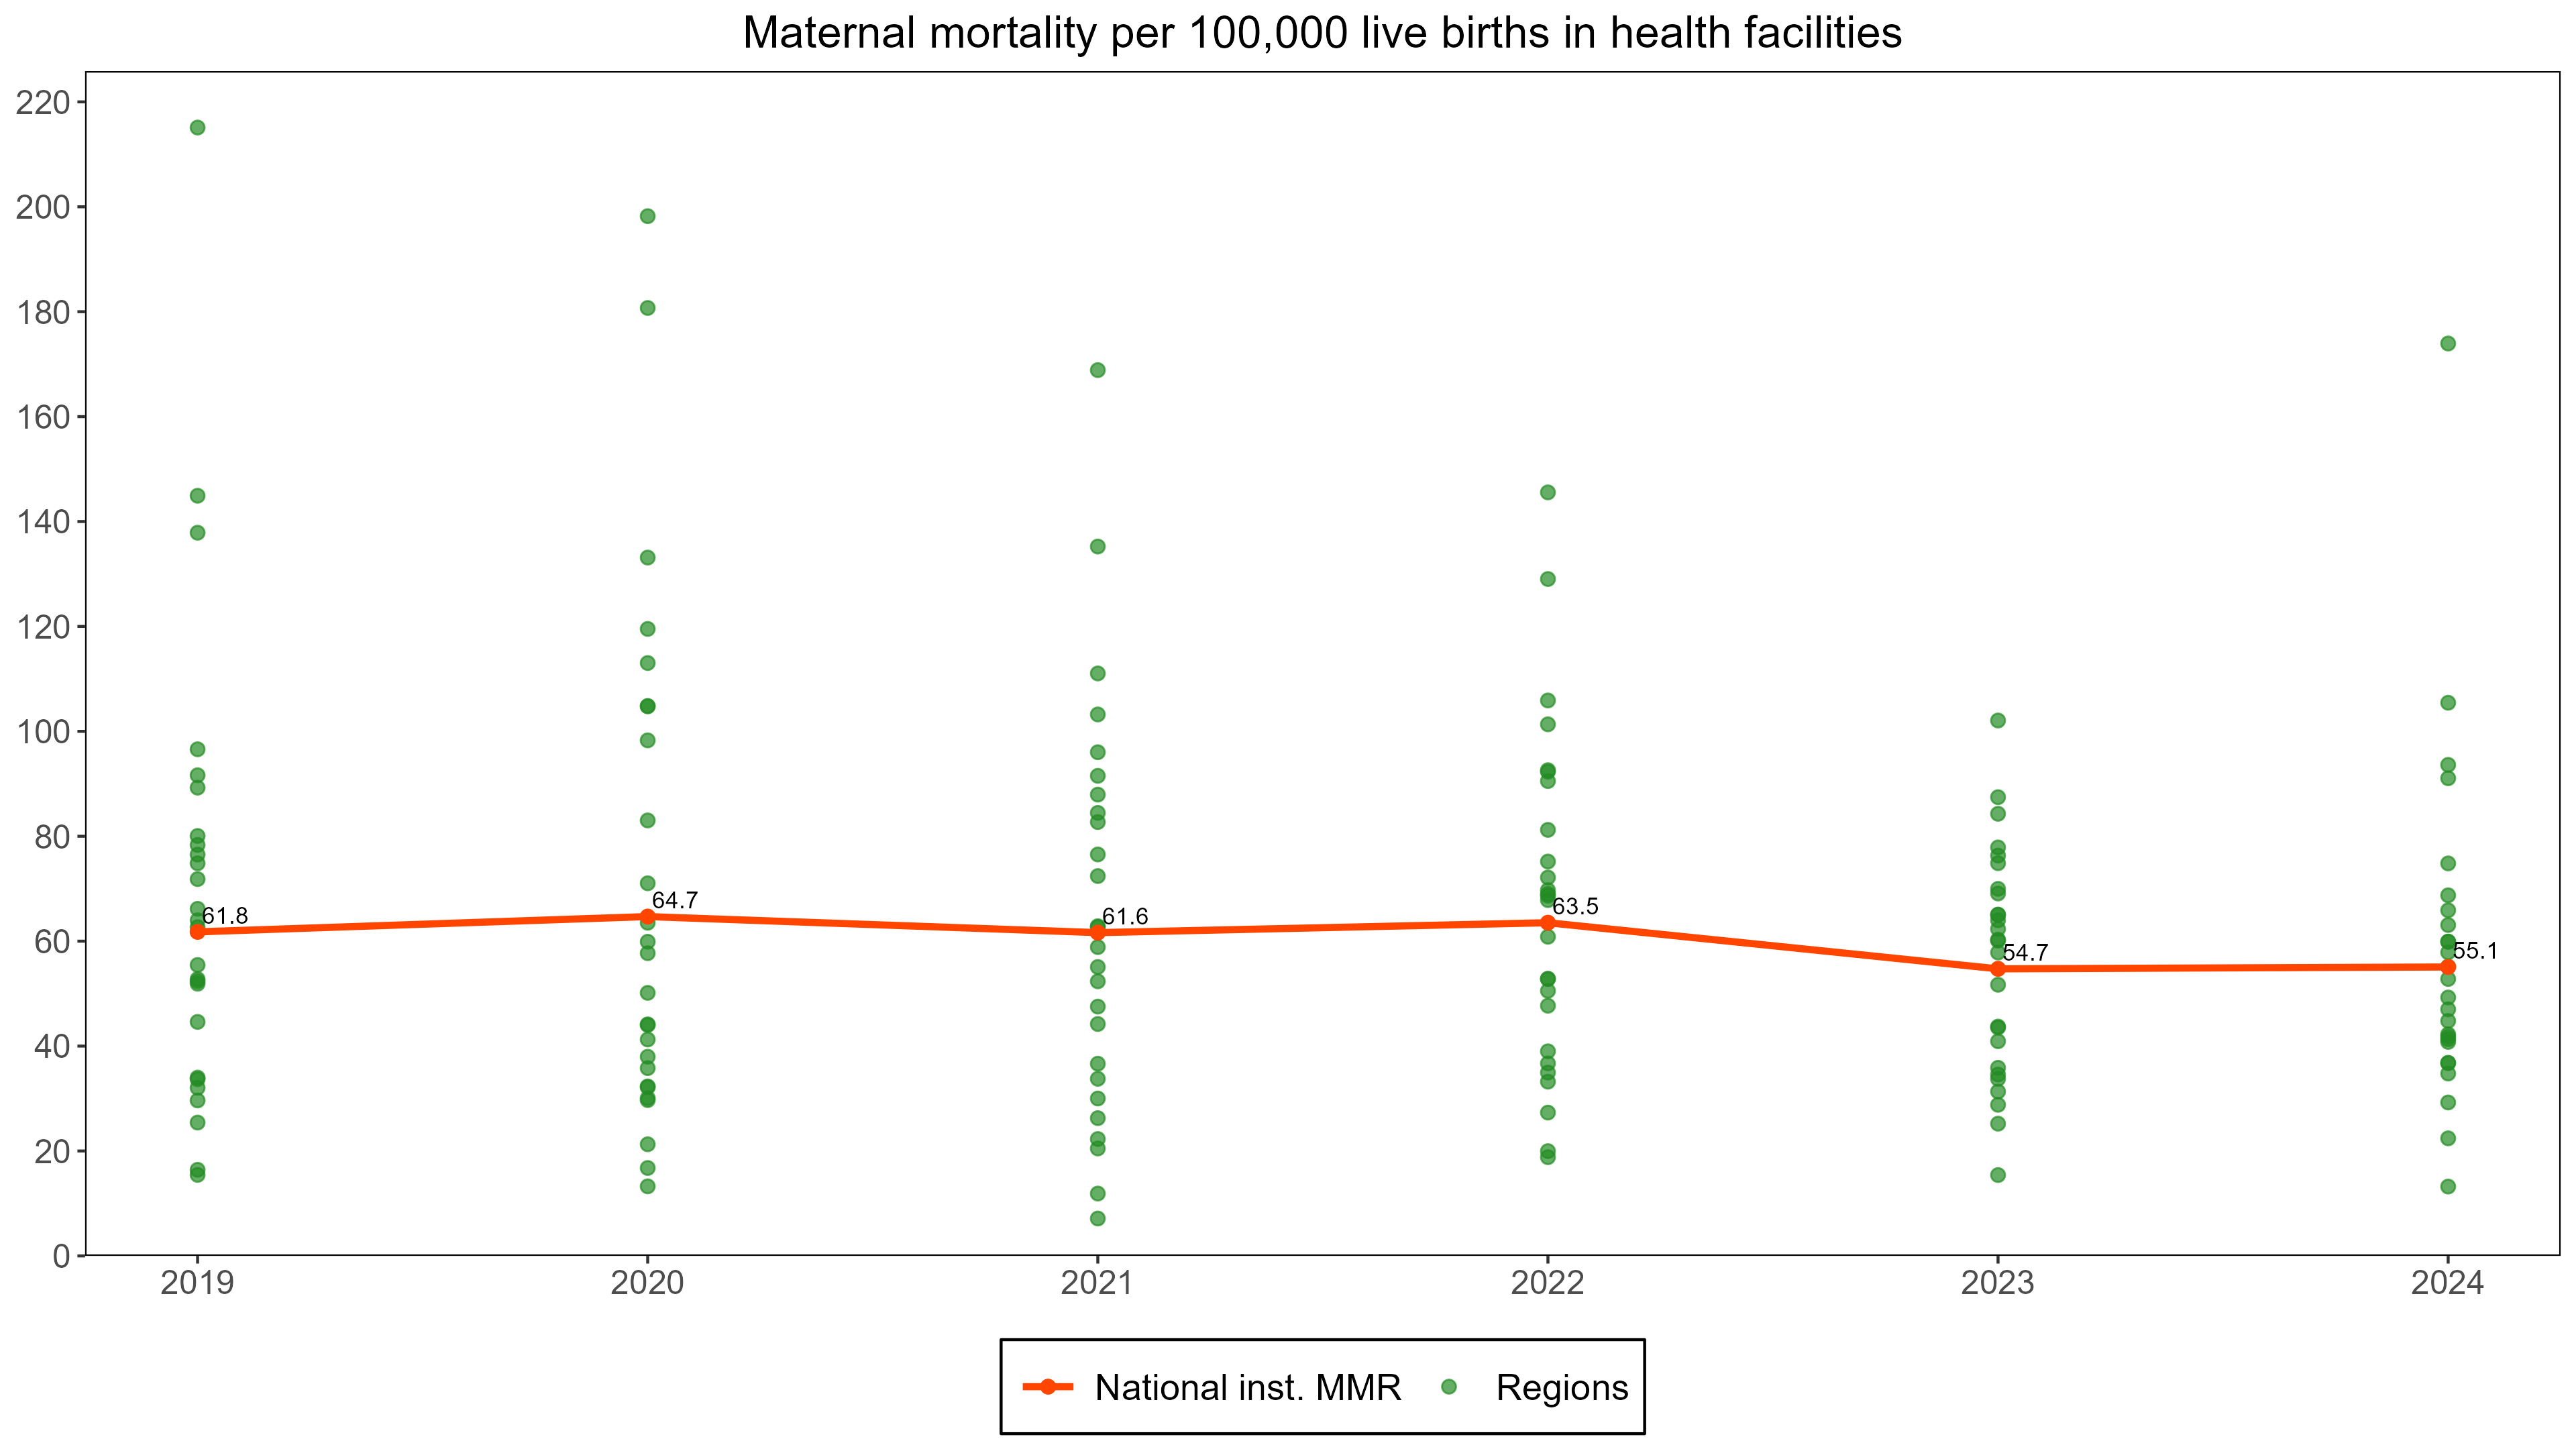
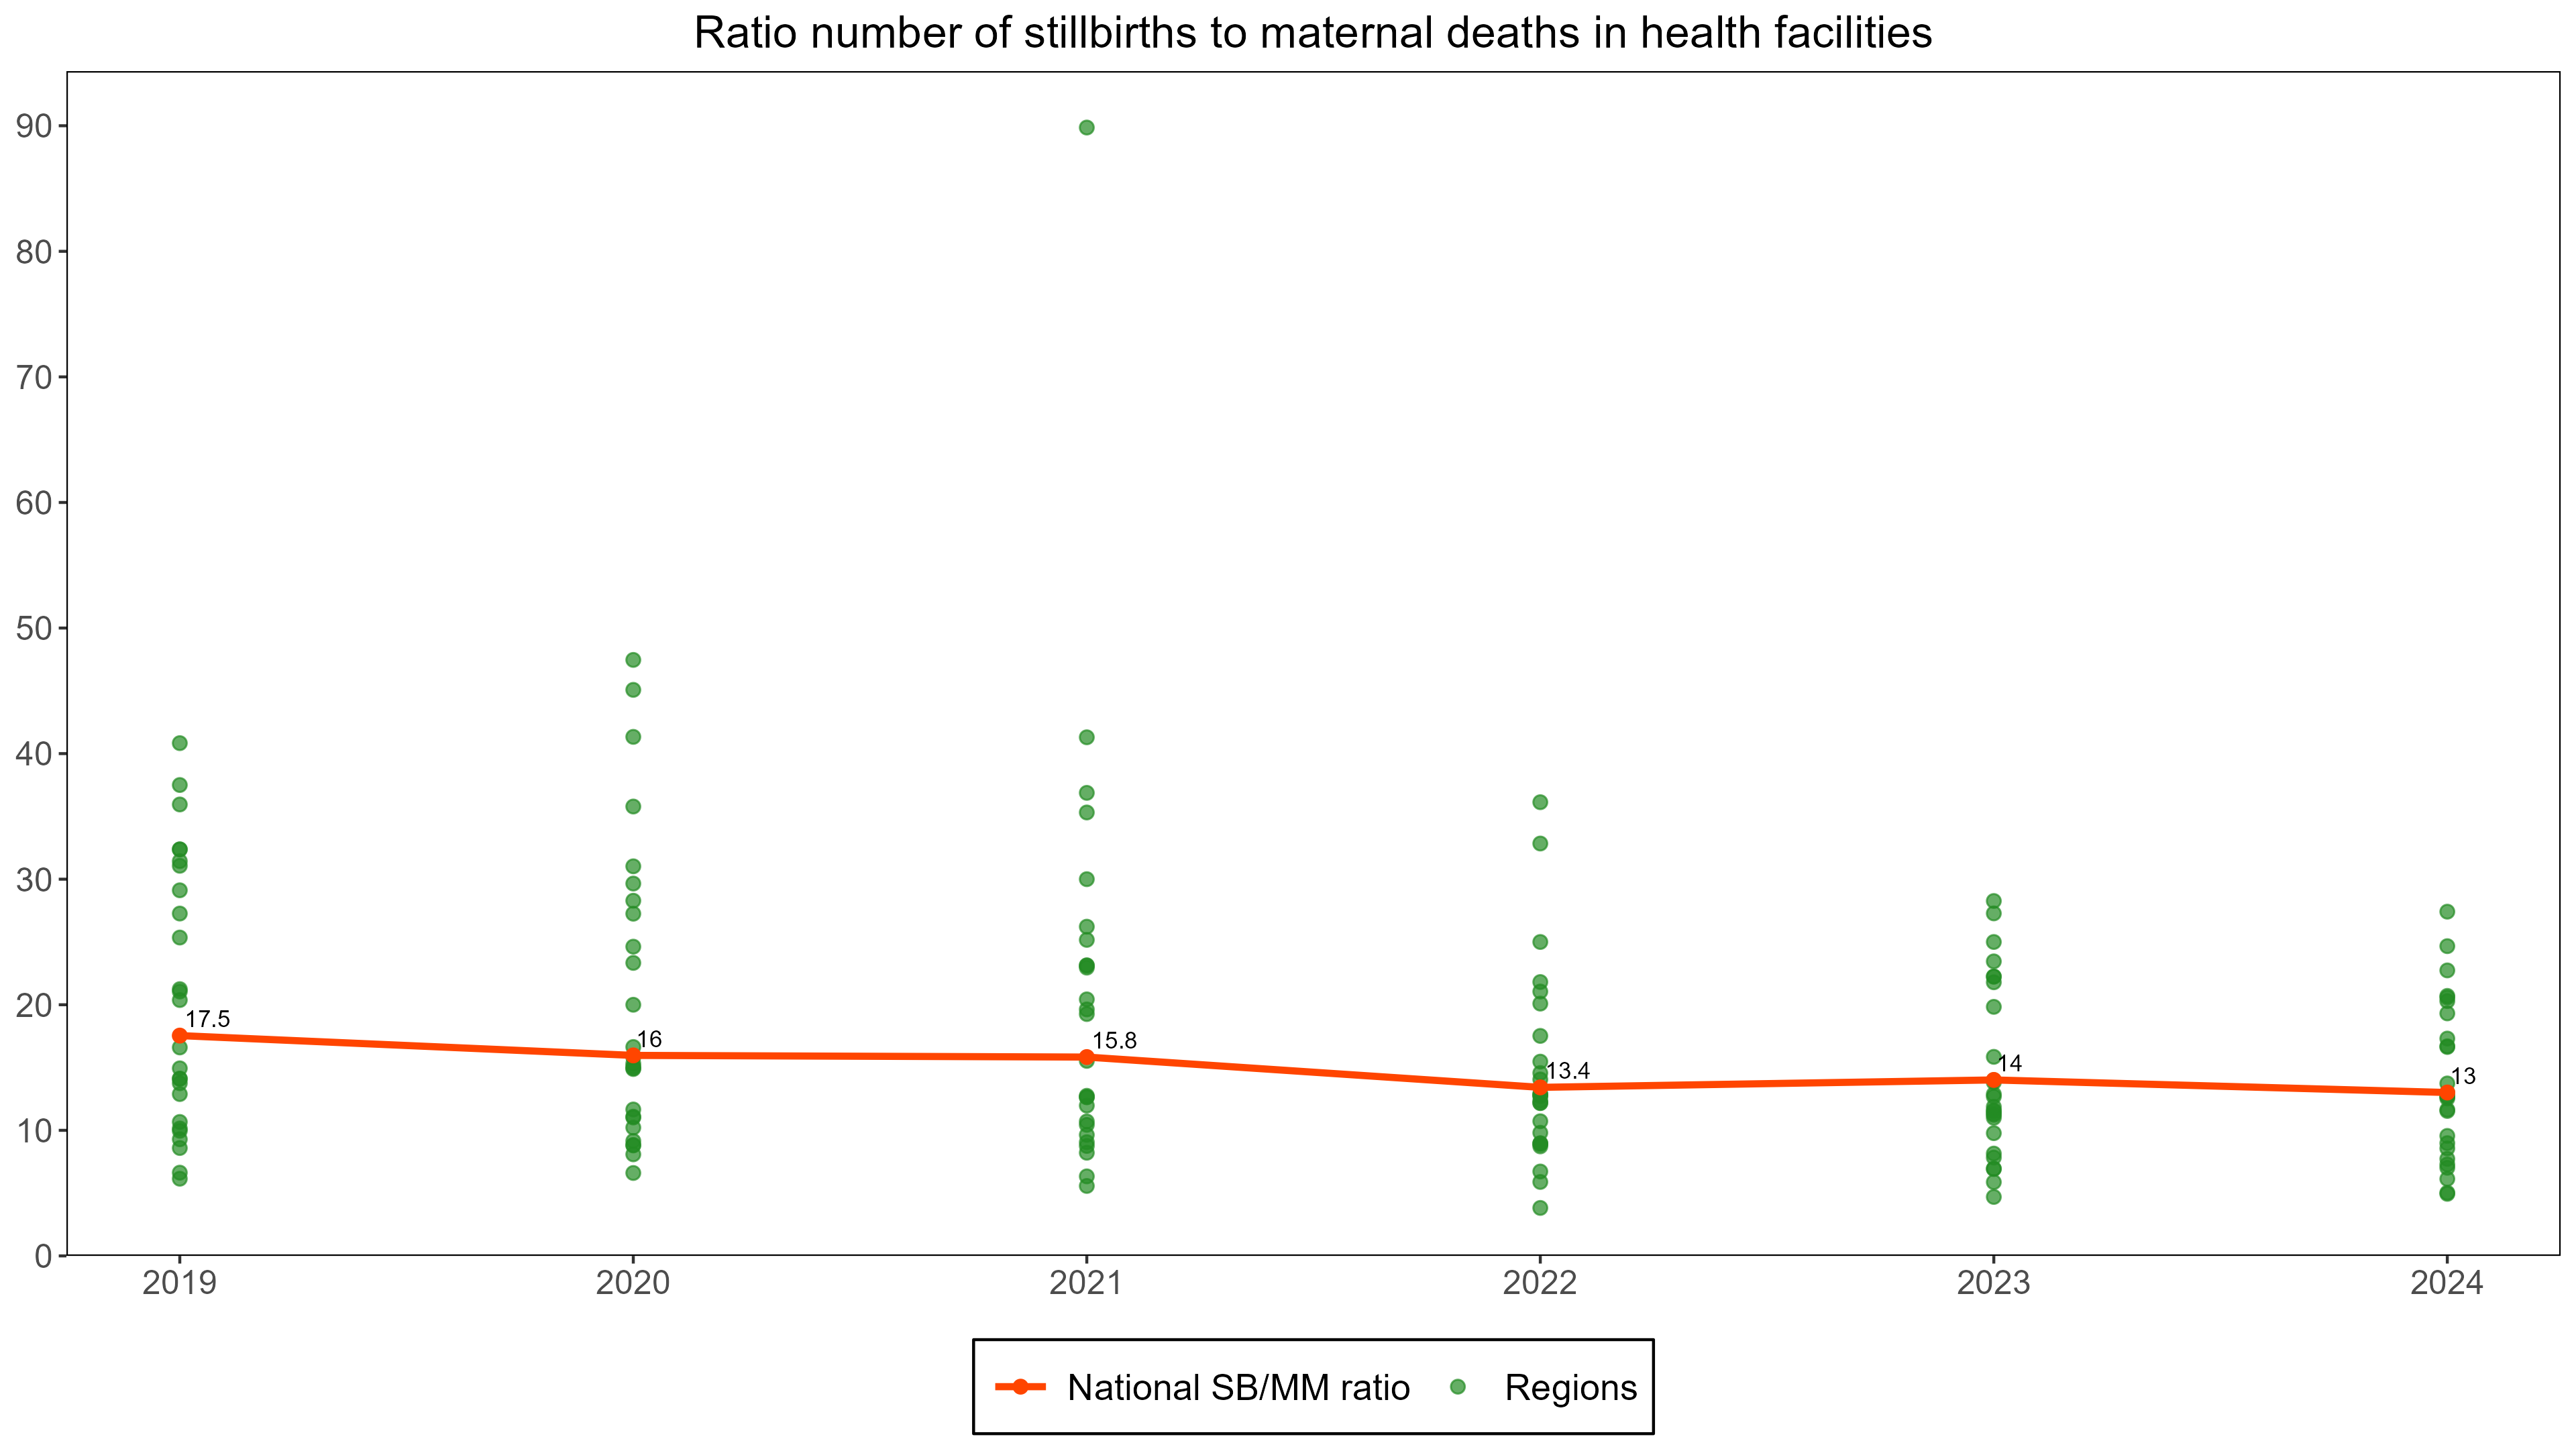
The figure below displays the institutional maternal mortality per 100,000 live births for regions (dots) and for the country as a whole (line and annual values) by year.
Several considerations need to be made:
- Are there any extreme outliers on the high side which may be due to major data errors which need correction?
- How many regions have implausibly low iMMR which is arbitrarily defined as less than 25 per 100,000 live births (25 is two times the MMR in high-income countries of 12.5); are these more advanced regions where mortality is expected to be lower, or are there less-developed regions with low mortality, which could be an indication of major under reporting of deaths.
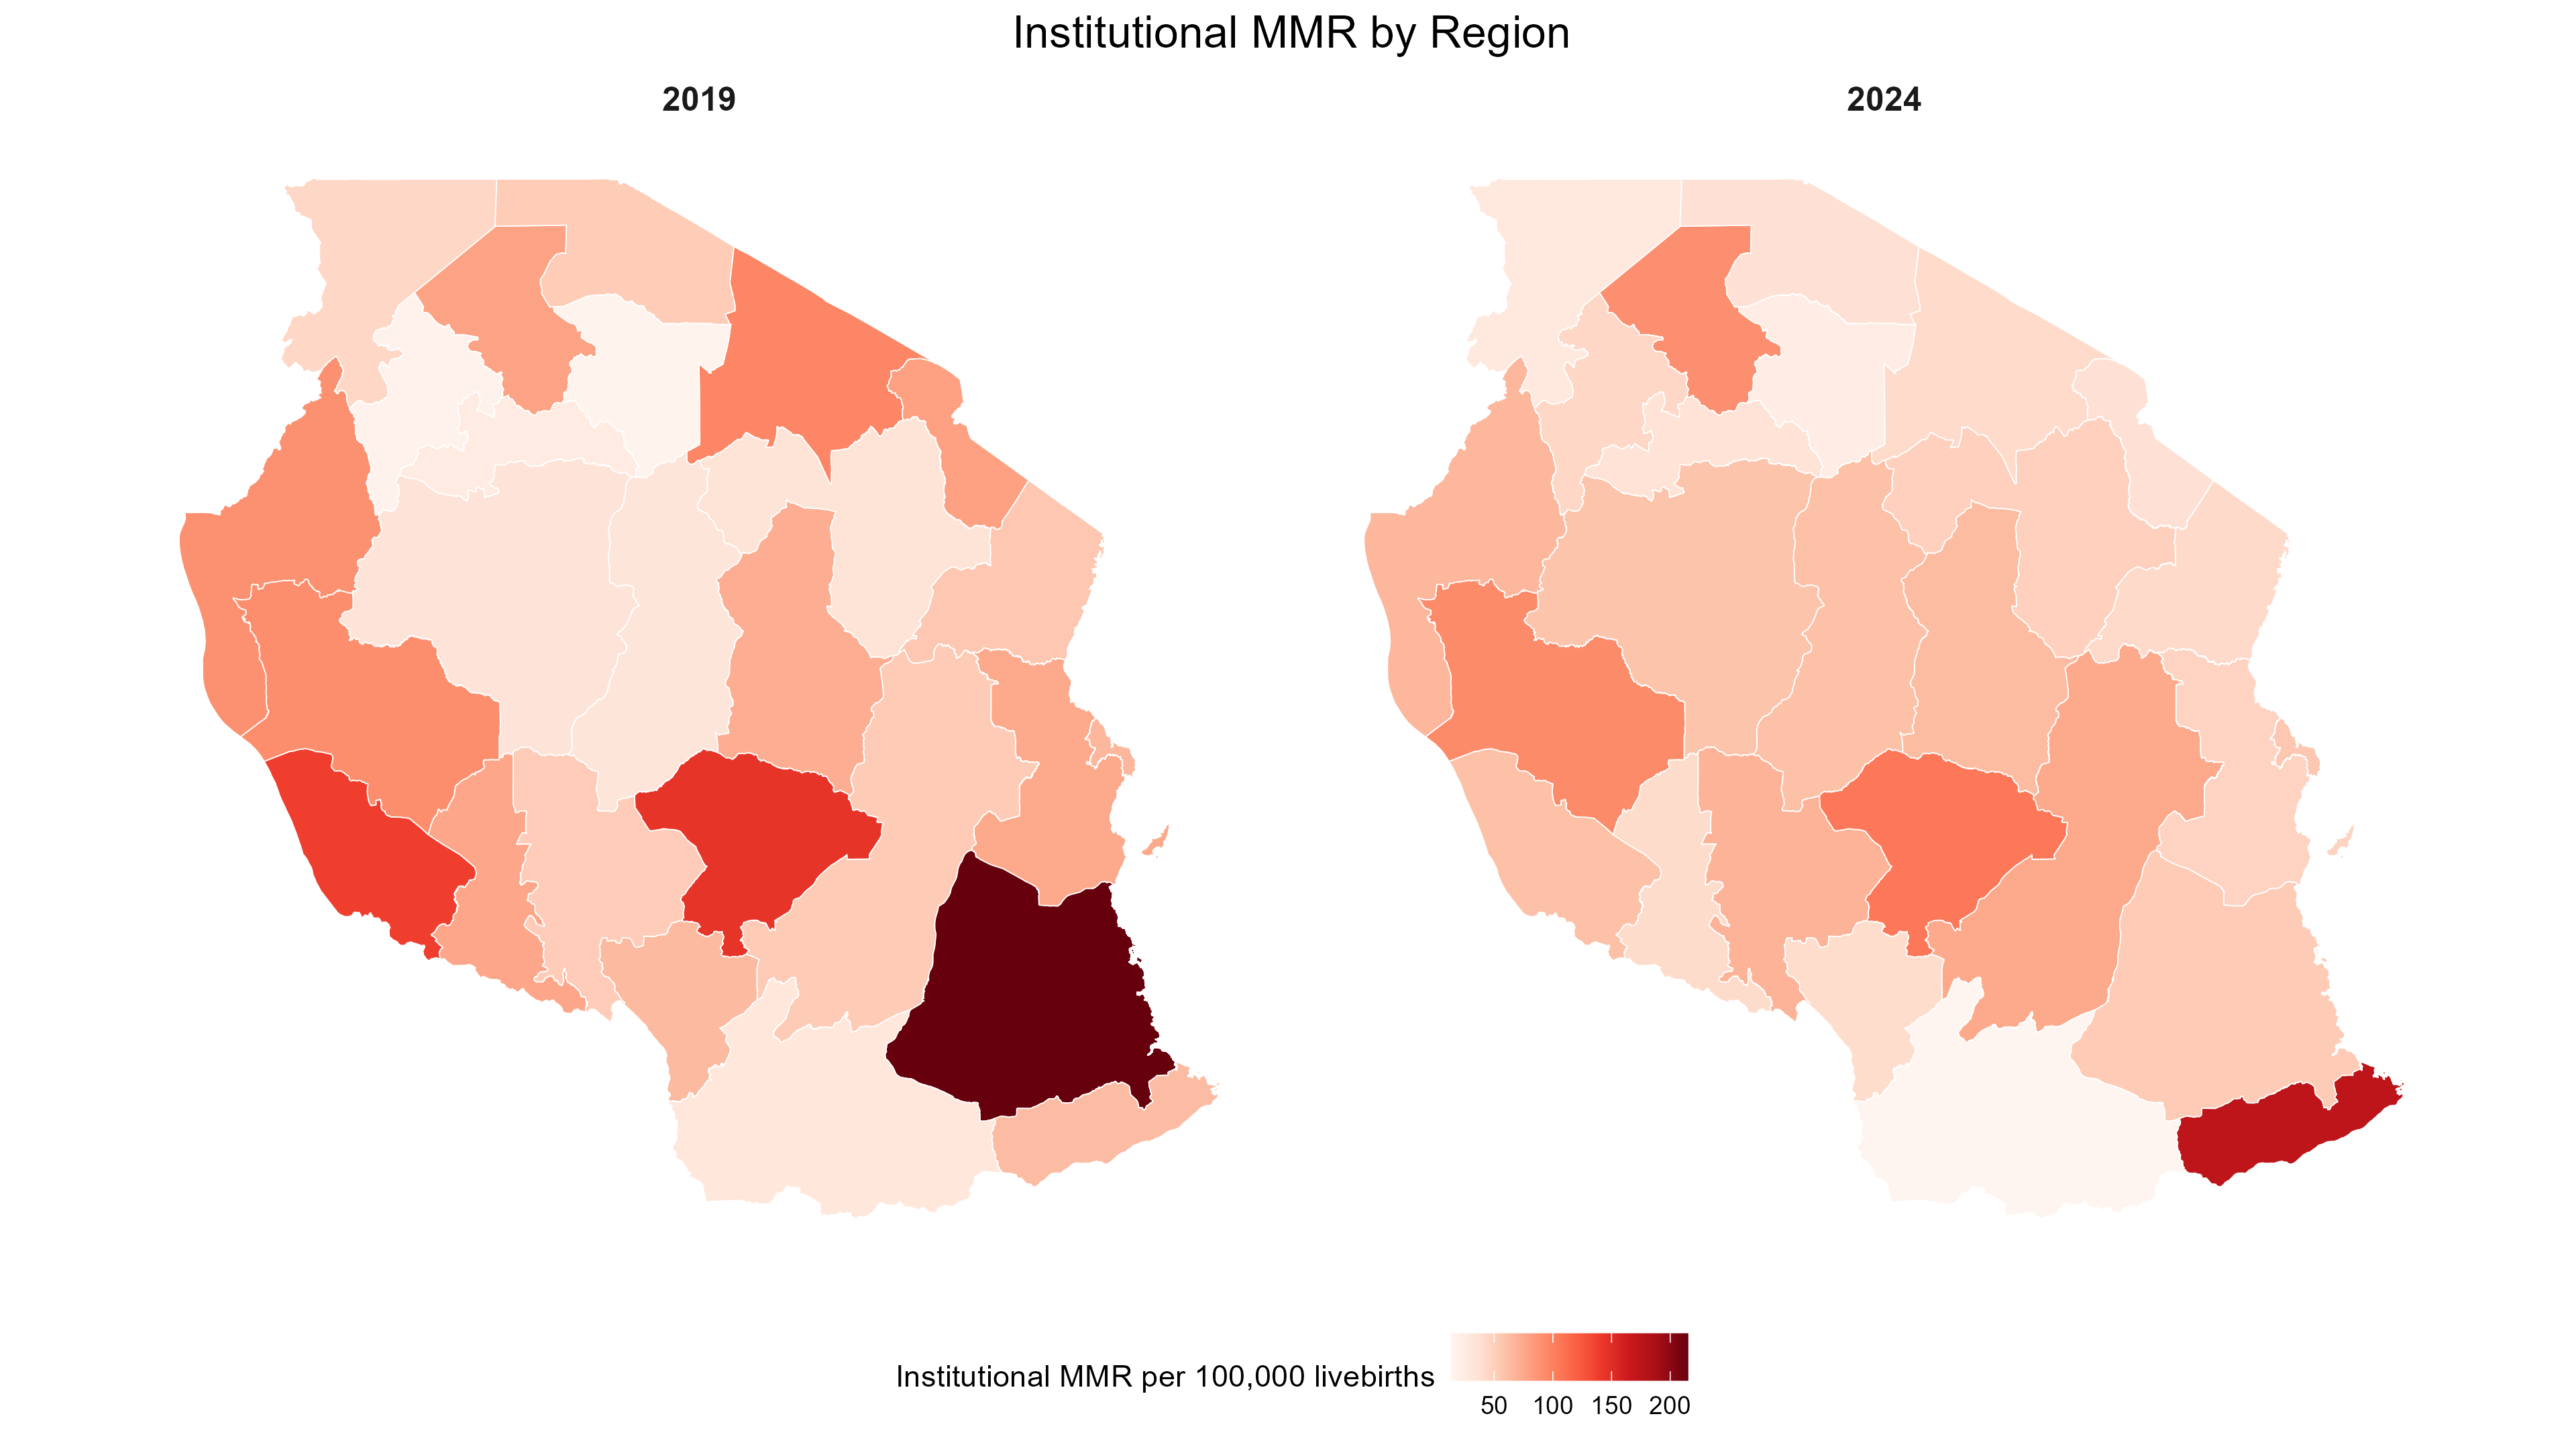
- A map with the iMMR by region would be a useful addition to guide the interpretation of the data, especially focusing on potential data quality issues.
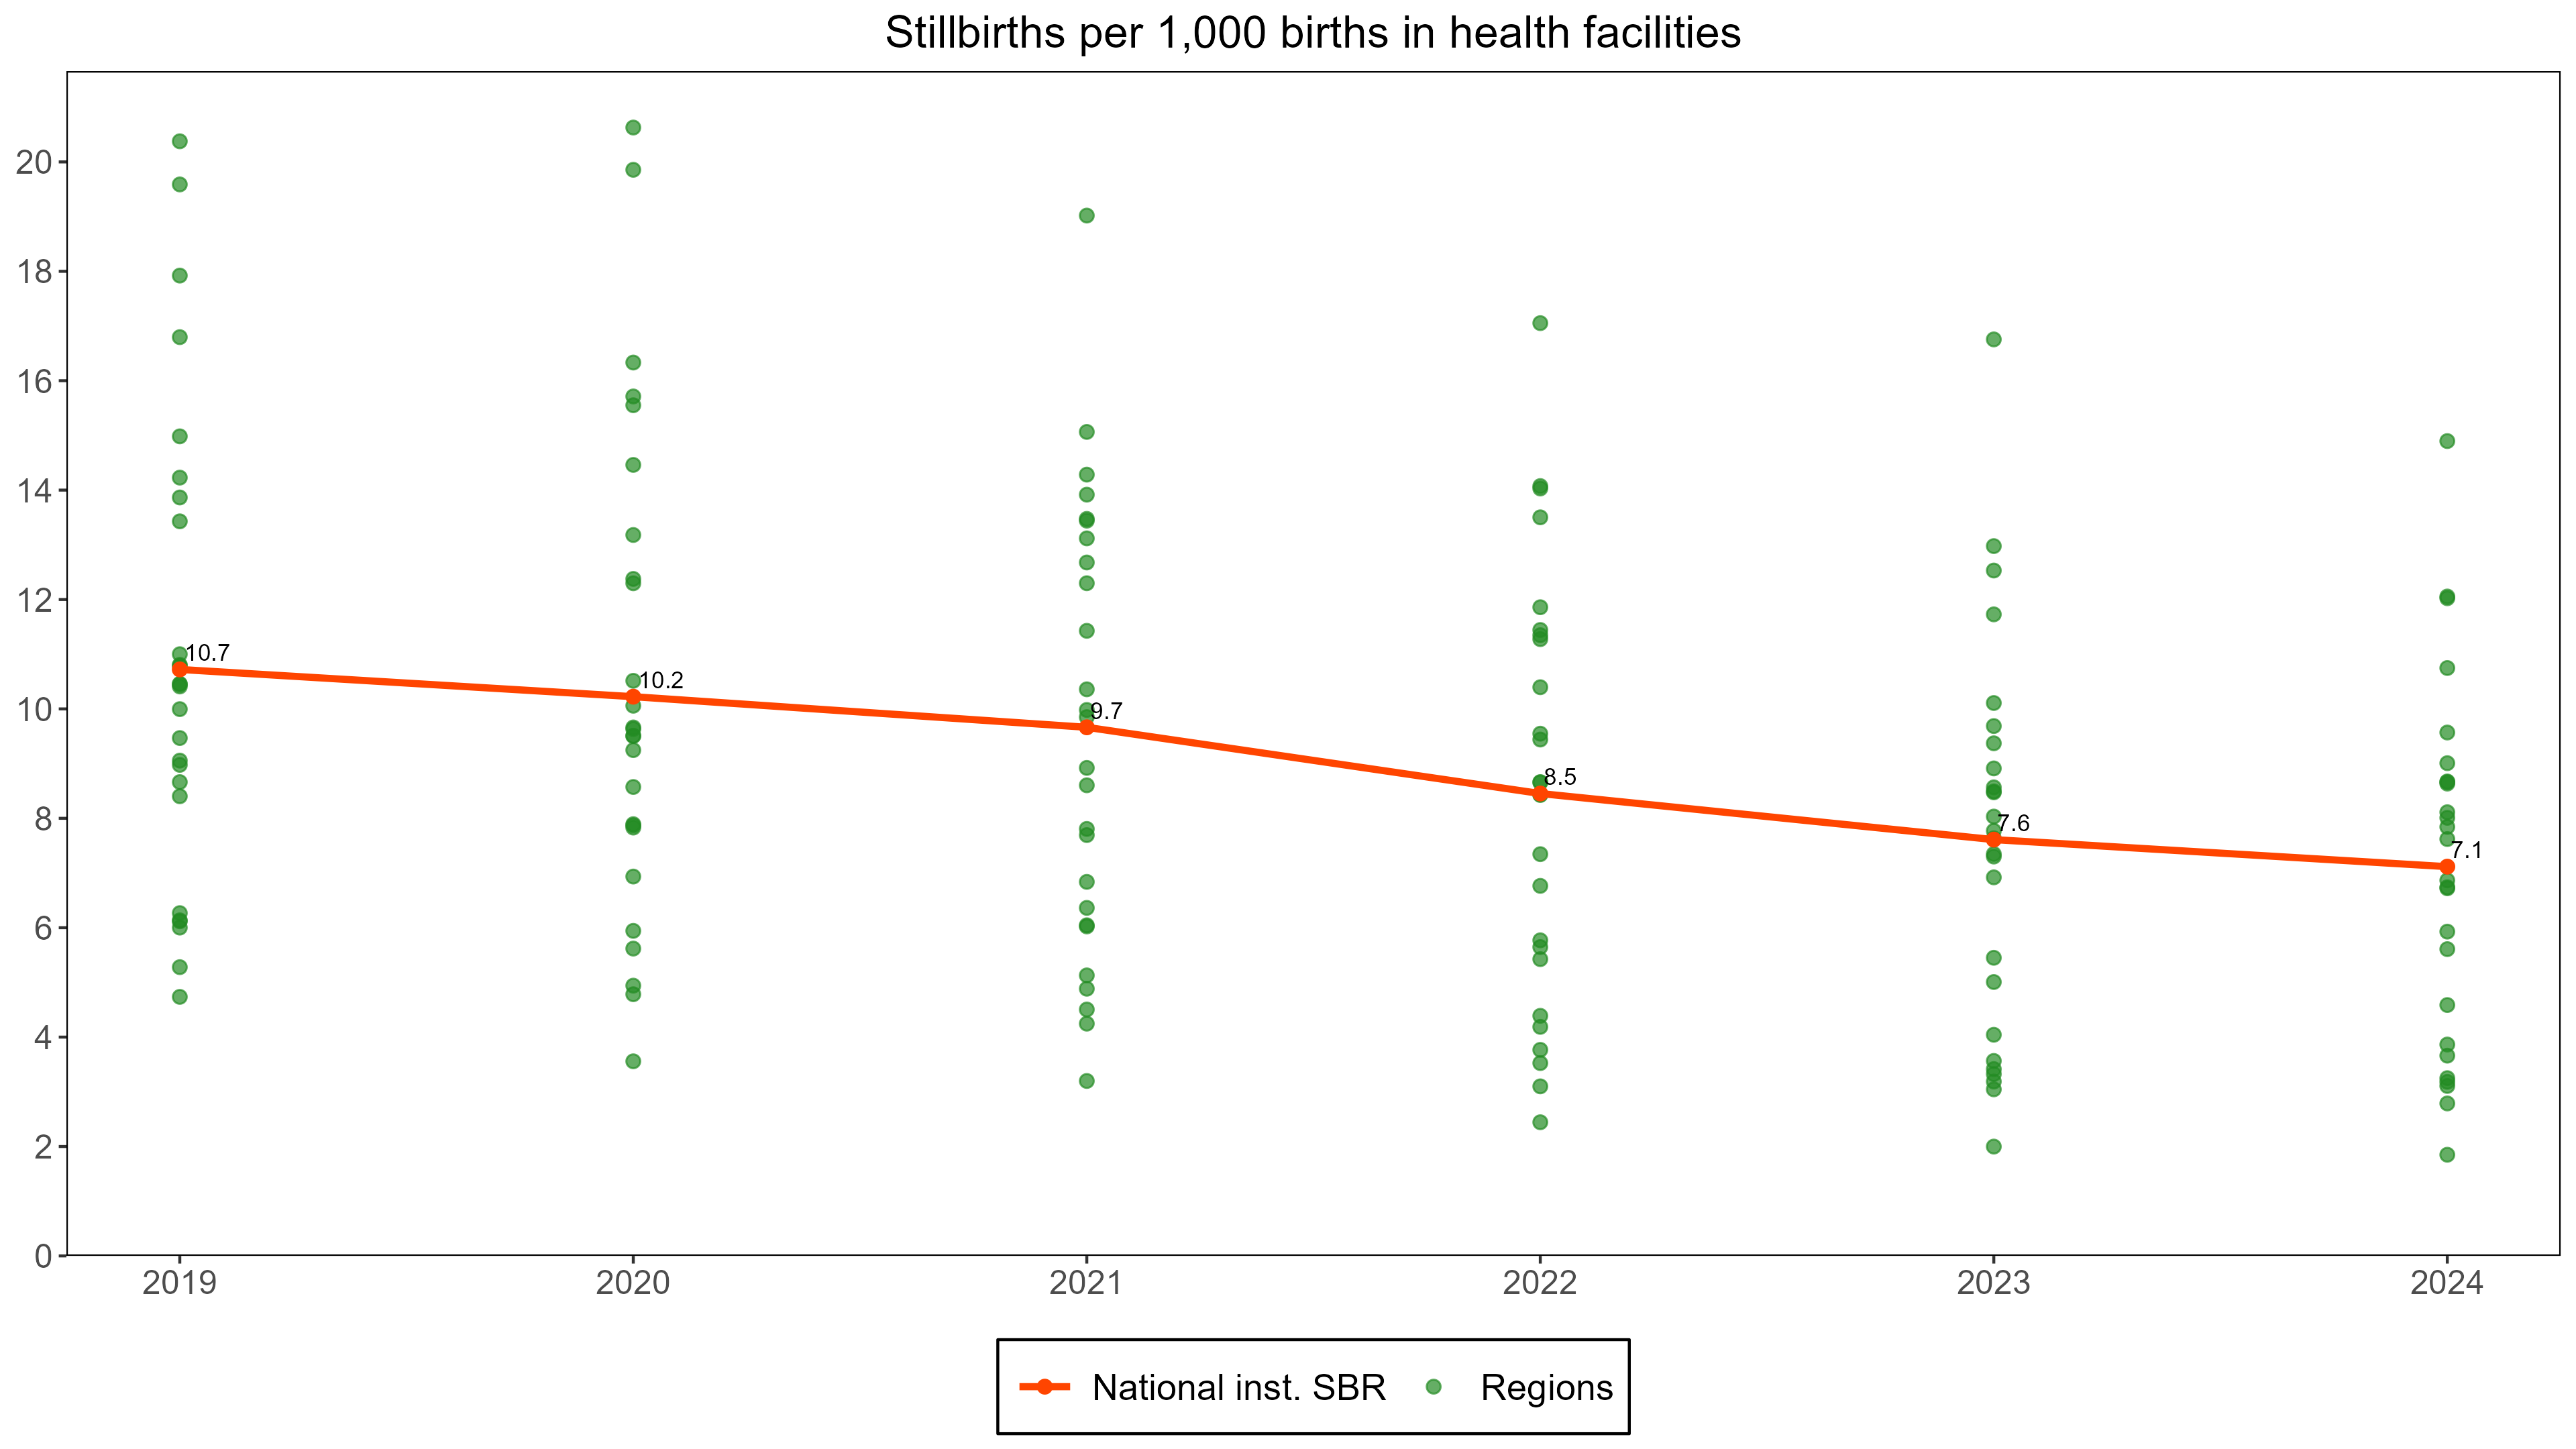
The figure below presents the stillbirth rate per 1,000 births for regions and the country, using the same format as for maternal mortality. The interpretation should explain:
How many regions have implausibly low iSBR which is defined as less than 6 per 1,000 births (which is two times the SBR in high income countries)?
Are these more advanced regions where mortality is expected to be lower, or is this a sign of major under-reporting of deaths in less-developed regions of the country.
In addition, the institutional mortality levels can be compared to the most recent mortality estimates for the population. These population estimates could be coming from a recent national survey or census, or we can use the UN estimates for maternal mortality (for 2020) and stillbirth rates (for 2021).
This is to obtain an idea of the difference between the institutional mortality and the population mortality. Interpretation should seek to explain:
- How far is the iMMR (or iSBR) from the UN estimates of the population mortality, including the uncertainty range of the global estimates: this difference will be used further to assess the data quality.
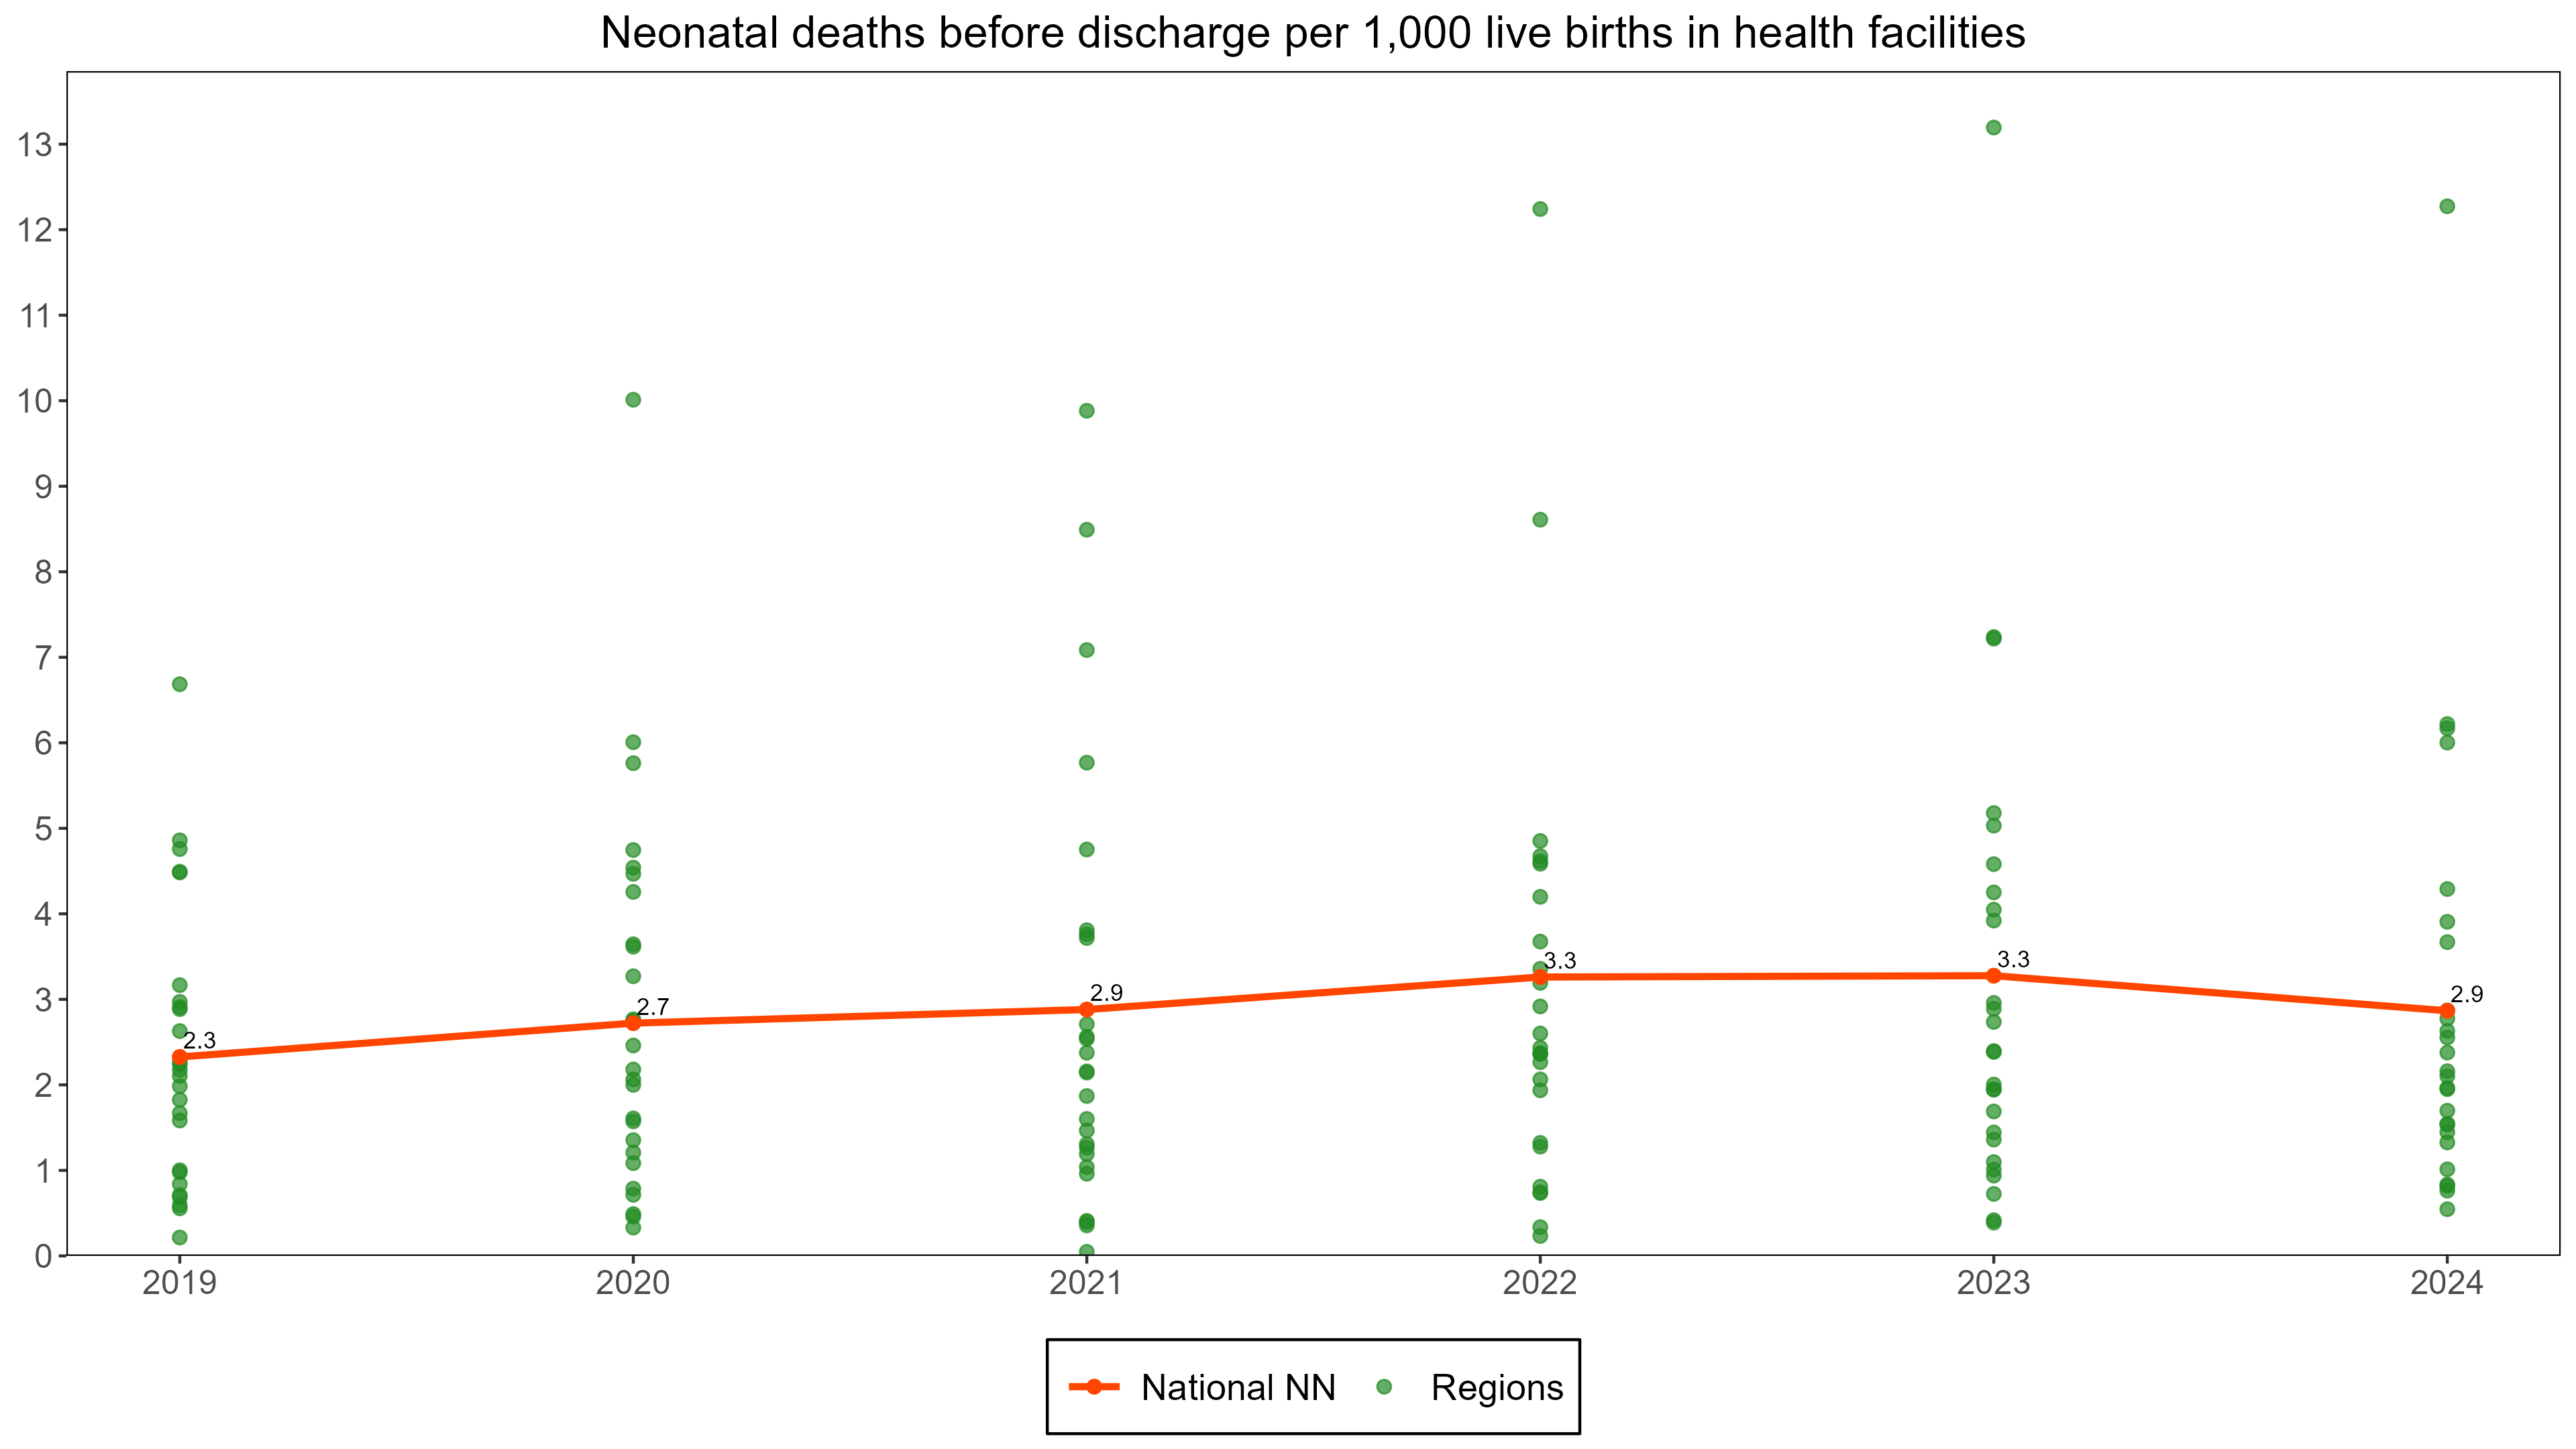
The institutional neonatal mortality rates (per 1,000 live births) based on reported neonatal deaths may also be graphed similar to iMMR and iSBR, but have to be interpreted with additional caution. Almost all babies stay at least 24 hours after delivery in the hospital but after that many are discharged and the observation time in health facilities is variable. Therefore, the statistic is mostly referred to as neonatal deaths before discharge per 1,000 live births, which includes day 1, some deaths on day 2, fewer deaths on day 3 etc.
A rough guide to assess reporting completeness is that expected mortality of neonatal deaths before discharge in health facilities should be at least half of neonatal mortality in the population. So for instance, if population neonatal mortality is 20 per 1,000 live births, we expect institutional neonatal mortality at least 10 per 1,000 live births in the health facilities.
16.3 Data Quality metrics
- Ratio stillbirth to maternal deaths in the health facility data at national level
We expect maternal mortality and stillbirth to be positively correlated given the commonalities in causes. Based on a review of the global estimates, historical data, and health facility studies, we expect the ratio of stillbirth to maternal death to be in the range of 5 to 25 for countries in sub-Saharan Africa. We compute the ratio as the number of reported stillbirths divided by the number of reported maternal deaths in DHIS2 or MPDSR, in a specific time period (usually a year) and raise a “data quality flag” if the ratio is outside the 5-25 range.
Interpretation:
- If the ratio is lower than 5: under-reporting of stillbirths is likely greater than under-reporting of maternal deaths
- If the ratio is equal or greater than 25: under-reporting of maternal deaths is likely to be the main issue, under-reporting of stillbirth less serious than for maternal deaths.
- If the ratio is between 5 and 25: under-reporting of maternal deaths and under-reporting of stillbirths are both possible, or reporting of both is of good quality (this requires that the level is also in the expected range - component 1).
- Consistency of institutional MMR with estimated population MMR and community MMR
The completeness of reporting by health facilities can be estimated by comparing the reported iMMR based on facility data with an expected iMMR. The population MMR, community MMR and institutional MMR should be consistent. There will be variation in the community to institutional MMR between populations, but it is not likely that, for instance, the community MMR is 1,000 when the institutional MMR is 100.
We compute an expected MMR in health facilities based on assumptions about:
- MMR in the whole population (including community and institutional deaths): For example, the lower bound, median, upper bounds of global estimates for each country (2023 UN estimates) could be used, or the results from a recent survey.
- Ratio of community to institutional maternal mortality: We use assumptions ranging from 1.0 (where we assume community MMR is the same as iMMR) to 2.0 and 3.0 (cMMR is 2 or 3 times higher than iMMR).4 For each country, one should consider what this ratio could be which may depend on the proportion of births in health facilities. There is some evidence that the community to institutional ratio increases as institutional birth rates increases, as well as the observed percent of births in health facilities.
The population MMR is the sum of the institutional and community MMR, weighted by the percent of births occurring in facilities. For instance, if the institutional MMR is 100 and the community MMR is 200, and 75% of births are in health facilities, then the population MMR equals \[ 0.75 * 100 + 0.25 *200 = 125 per 100,000 live births \] This can be expressed in the following formula:
\(M_{p} = P_{i}*M_{i} + \left( 1 - P_{i} \right)*M_{c}\)
Where;
- Mp = maternal mortality ratio in the population;
- Mi = institutional maternal mortality ratio;
- Mc= maternal mortality ratio in the community;
- Pi the proportion of live births in institution
Here, we have (1) iMMR from the DHIS2 data and (2) population mortality from the UN estimates, and can compute the community MMR as \[(125 - 0.75 * 100) / (1-0.25) = 200 \], or
\[ M_{c} = \frac{{(M}_{p} - {P_{i}*M}_{i})}{(1 - P_{i})}\]
In the example, the ratio community to institutional mortality \[(Mc/Mi) \]equals 200 / 100 = 2, in other words the community mortality is two times higher than the institutional mortality.
We can now compute the expected MMR based on 1) an estimate of population MMR 2) the ratio Mc/Mi. For instance, if 75% delivers in health facilities, the population MMR is 200 and the ratio (Mc/Mi) is 2, then the expected institutional MMR is \[ (200/(2-(2-1)*0.75) = 200 / 1.25 = 160 per 100,000 live births \] (and the community MMR is 320).
In a formula:5
Expected \[Mi =Mp / (Mc/Mi -((Mc/Mi)-1) * Pi))\]
Finally, the completeness of facility reporting is reported iMMR (e.g. based on DHIS2) divided by the expected iMMR. For instance, if the reported MMR was 100 and the expected MMR 160, then the level of completeness of reporting is \[100/160 * 100% = 62.5%.\]
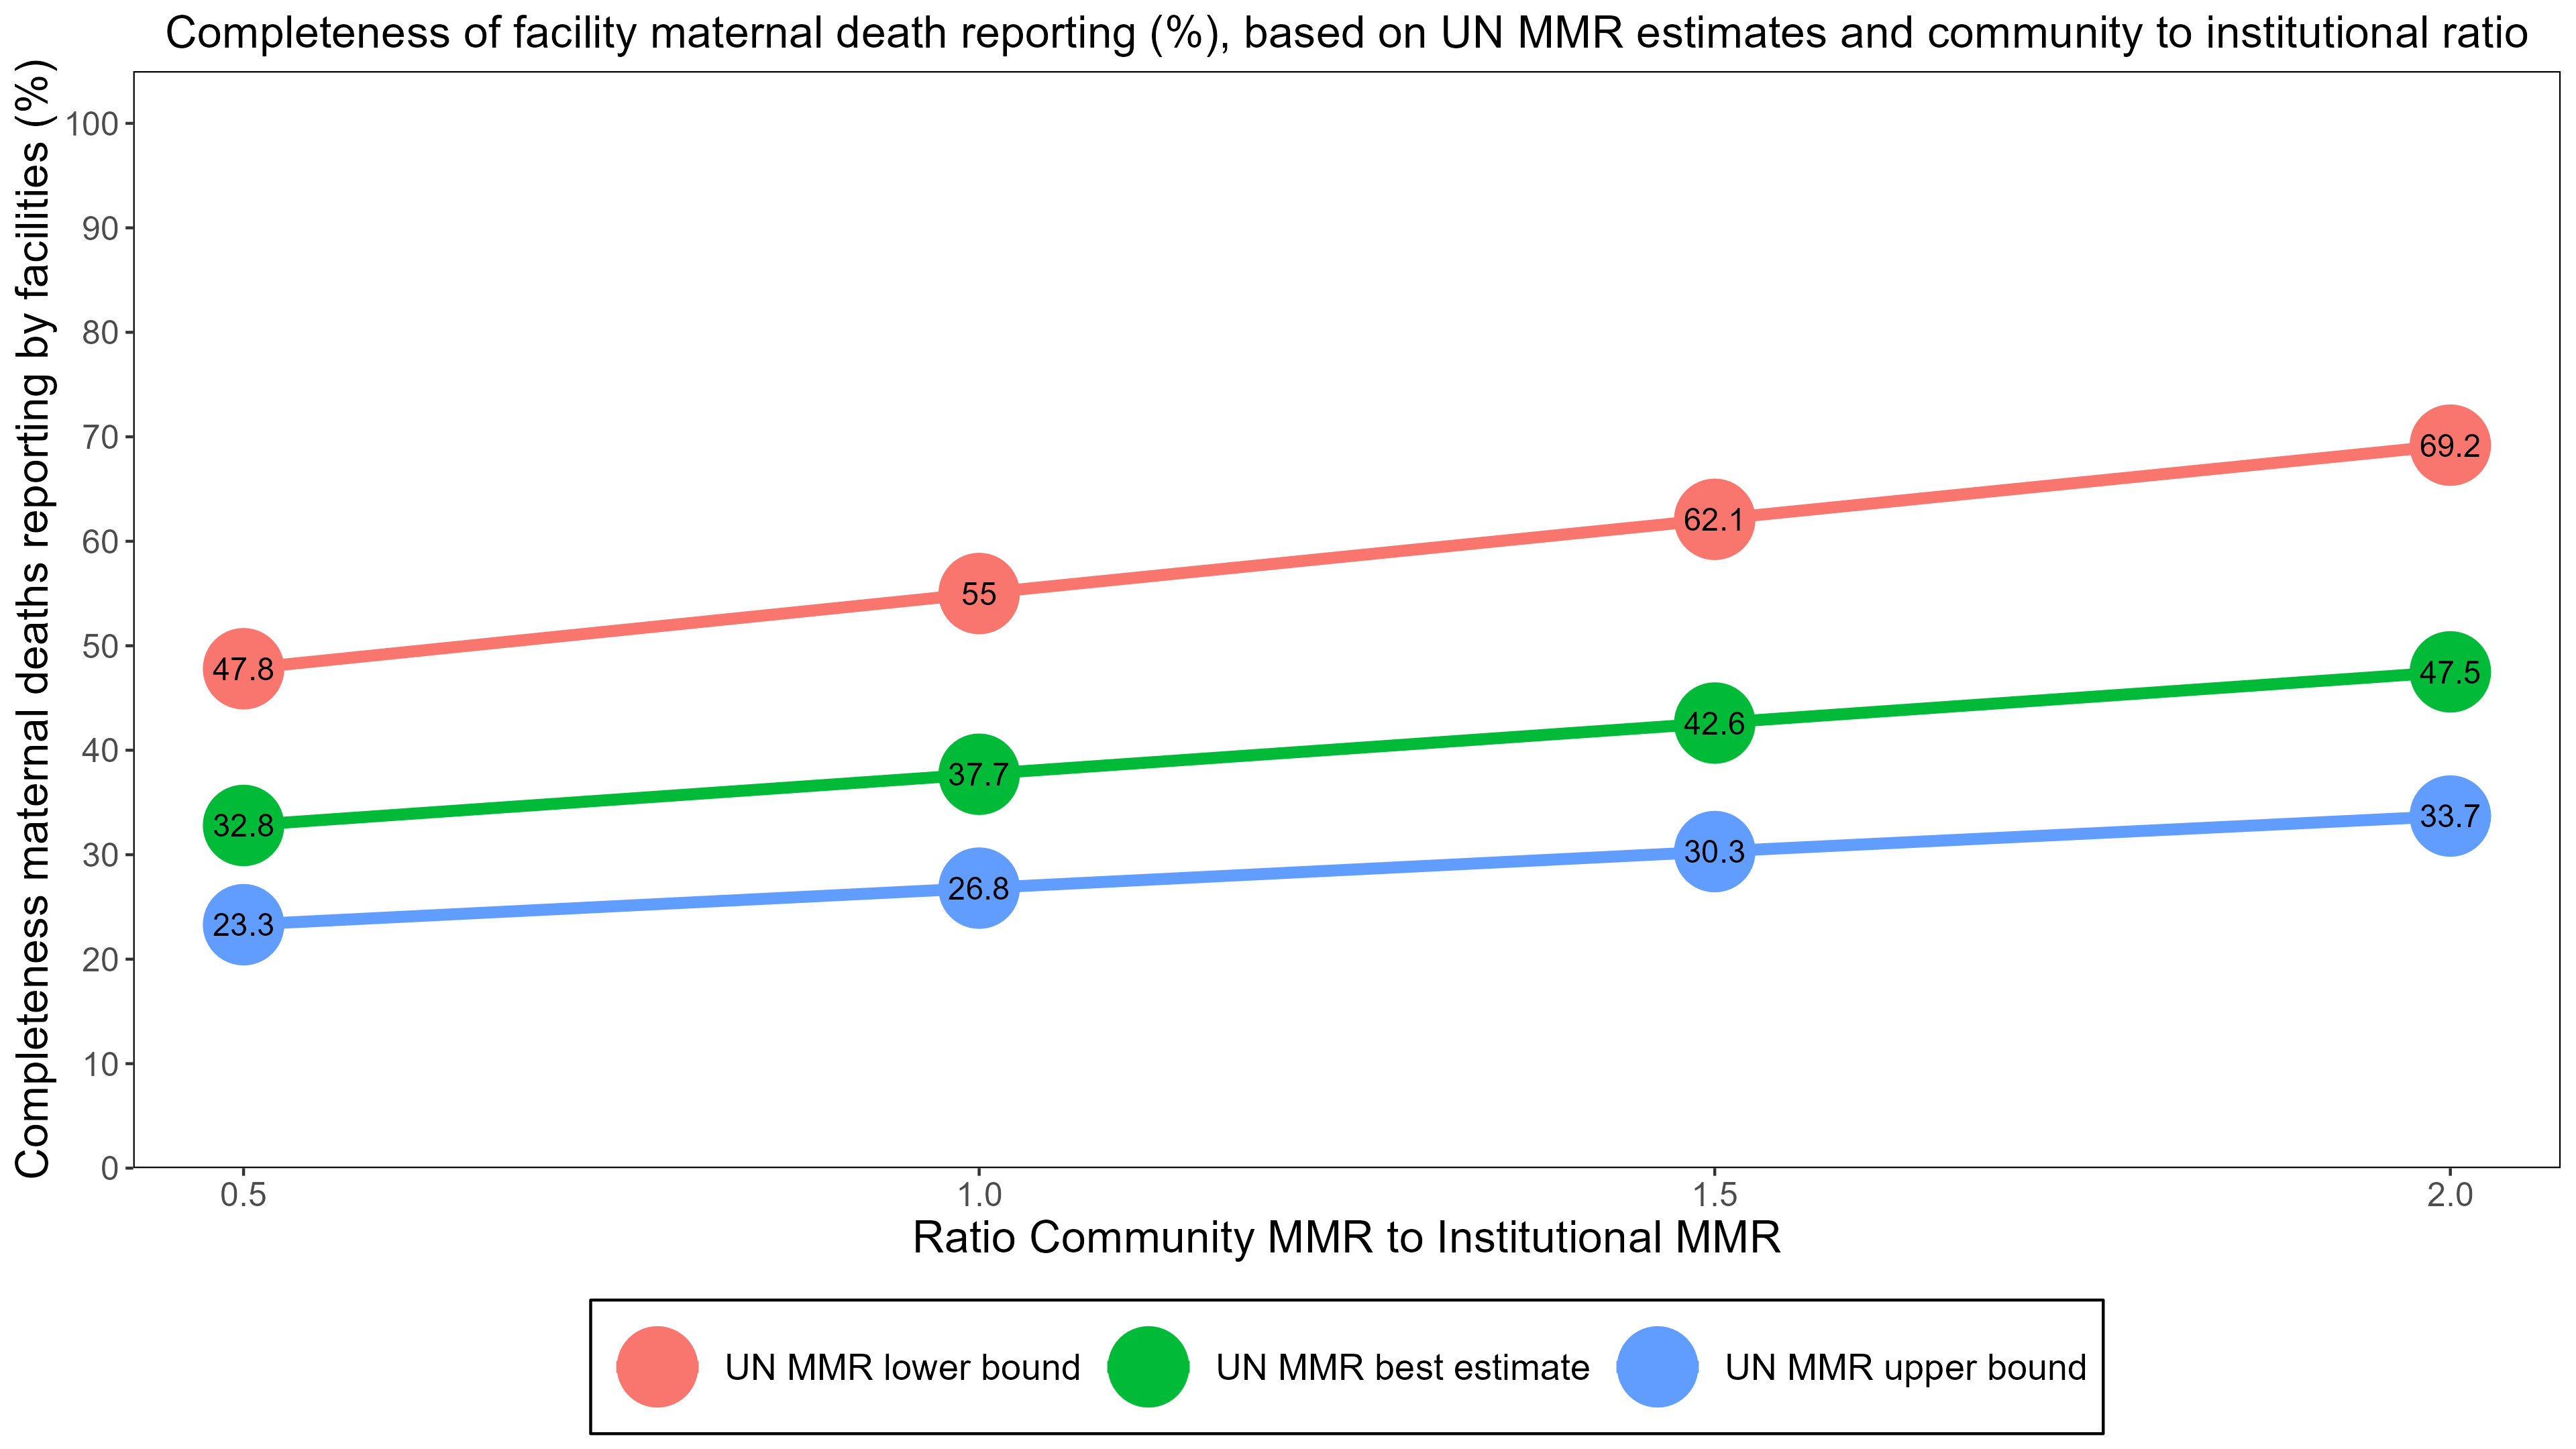
Below is an example of the estimated completeness of facility reporting of maternal deaths using different scenarios. The figure shows the results on completeness of reporting with three levels of population MMR (lower bound, median or best estimate, upper bound) and three community to institutional mortality ratios (0.5-2.0), shown on the X-axis.
Not all scenarios are equally relevant to each country. For instance, if there is evidence that the population MMR is lower than the UN median, pick the scenario with the lowest MMR (the red line). If it is considered that community MMR could be 1.5-2.0 times higher than institutional MMR, then the completeness estimate is 62-69%. The choices are arbitrary, but it is useful to consider if the range of estimates of completeness of facility reporting can be narrowed down by using the most plausible scenario. As default values, the ratios of 1.0, 2.0 and 3.0 are used.
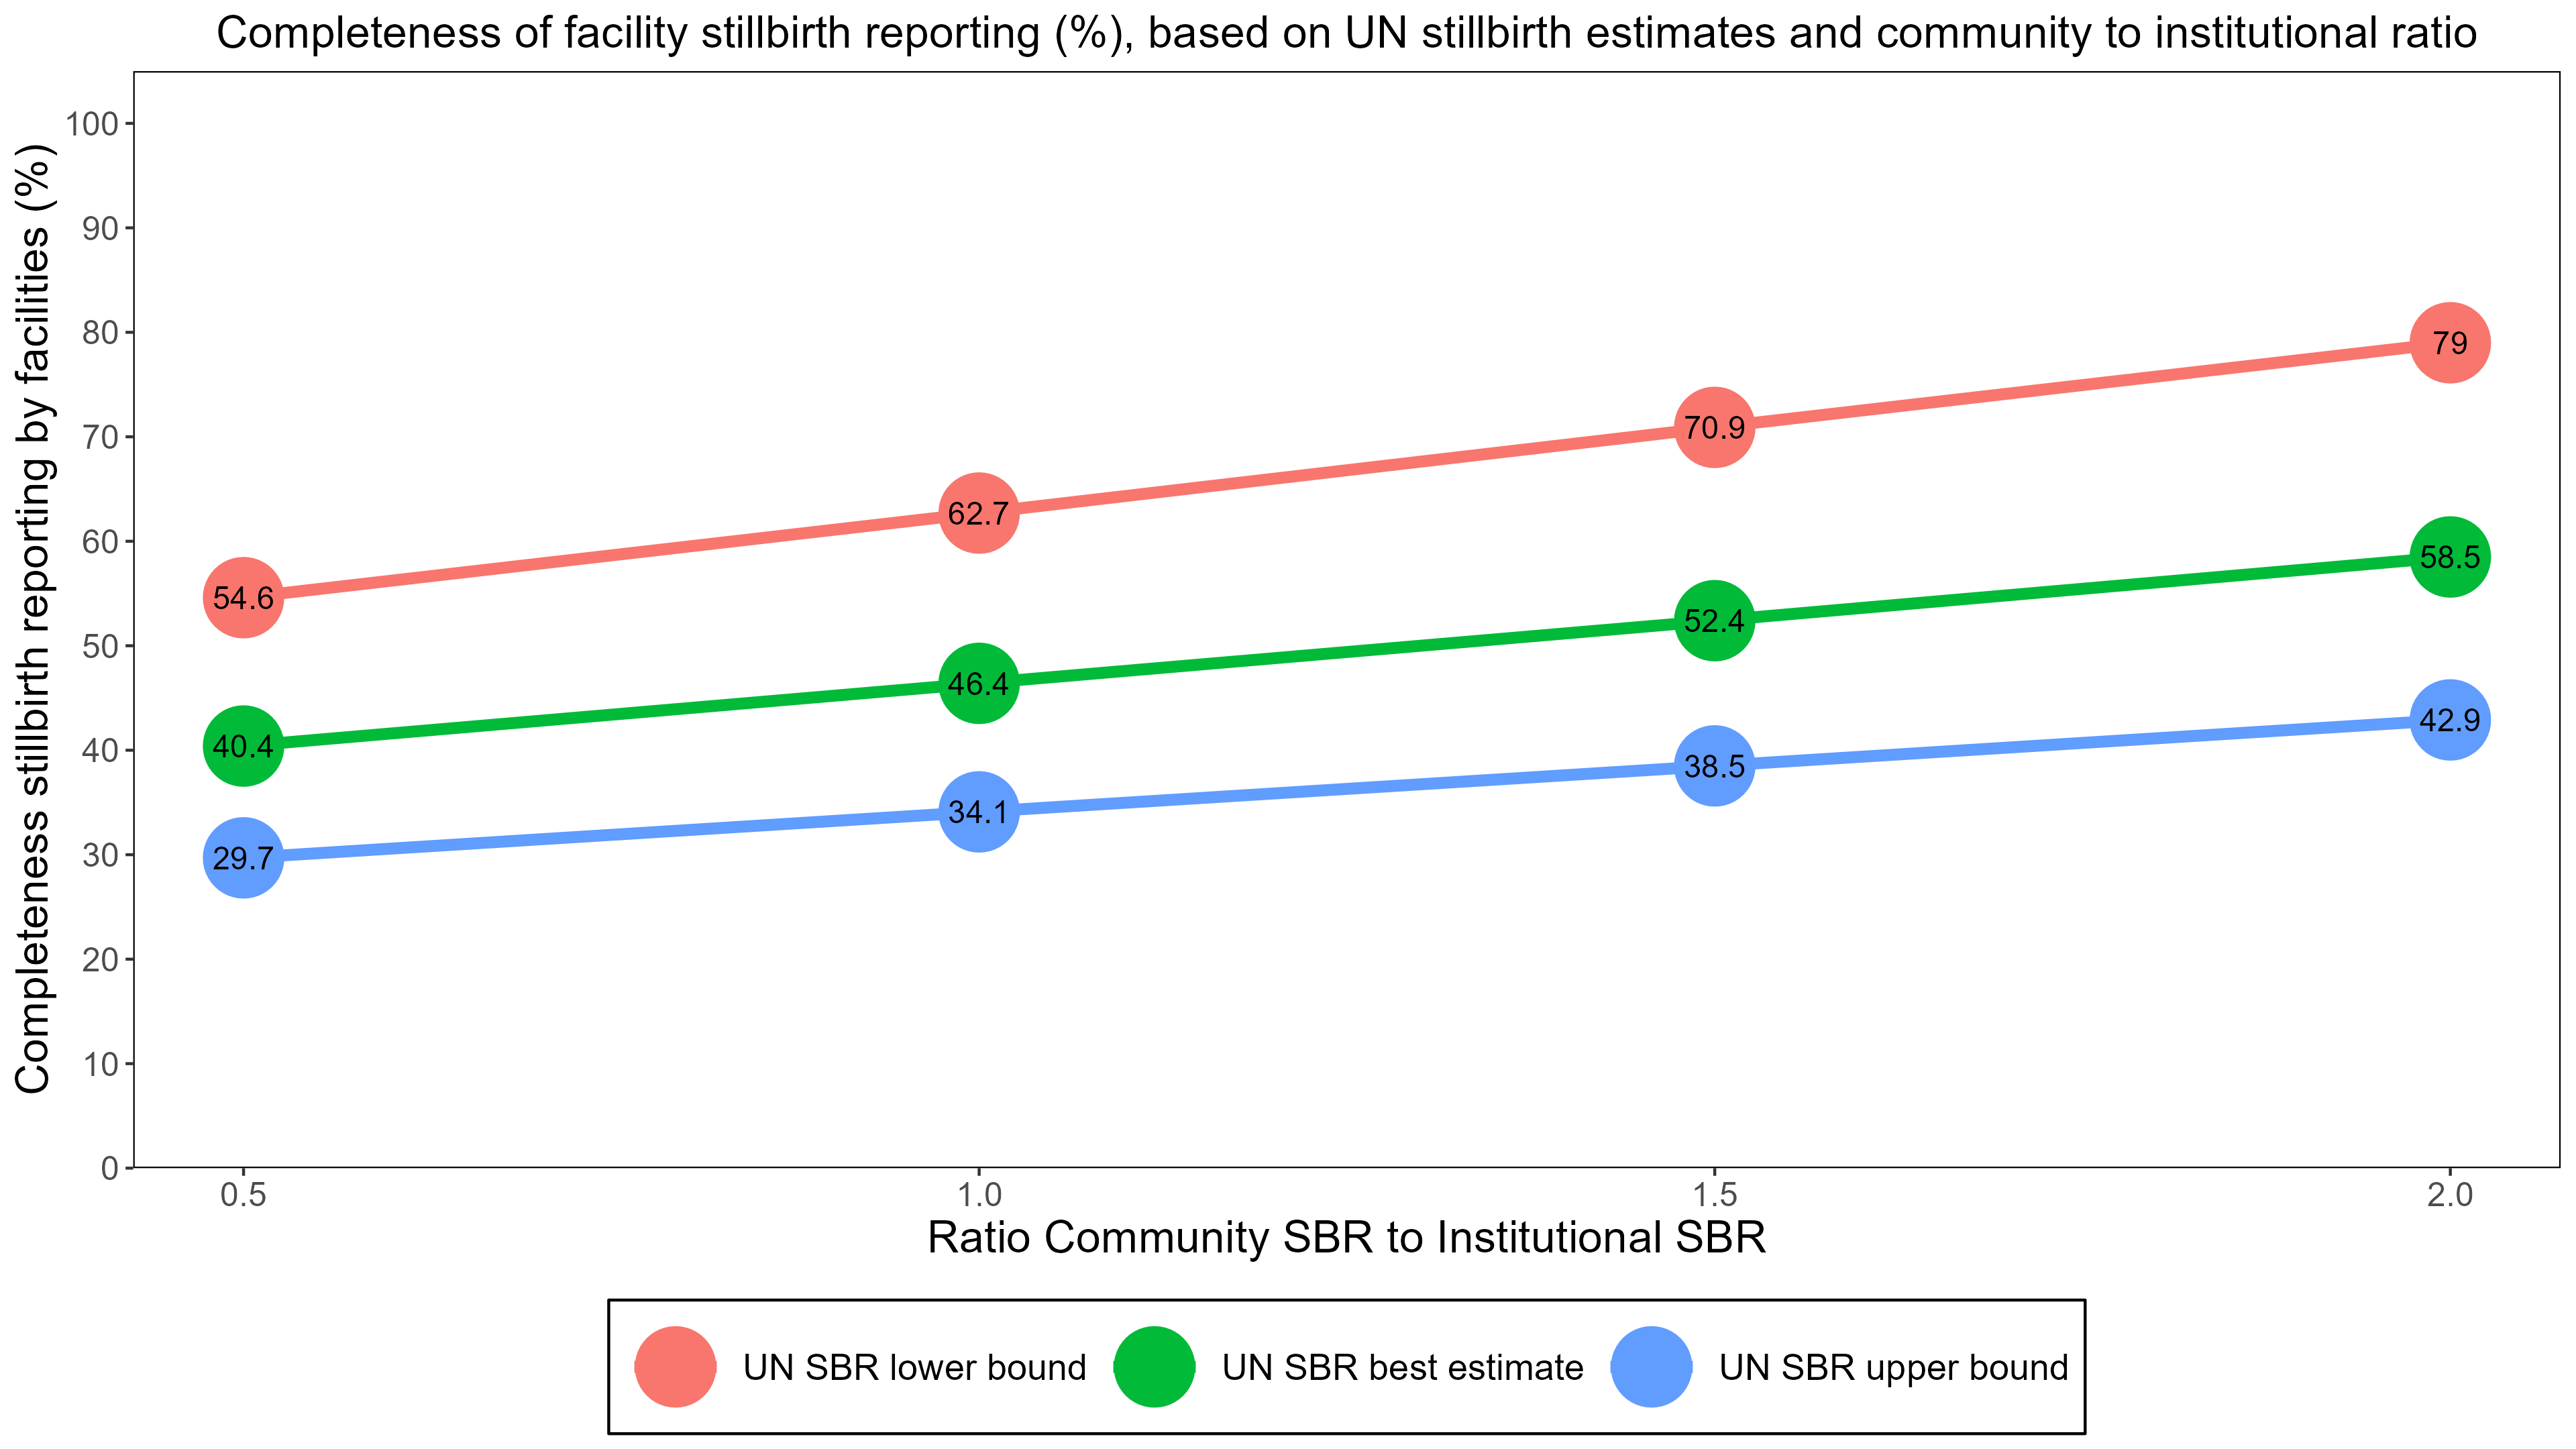
A similar approach can be used for stillbirths using all births instead of live births. The UN global stillbirth estimates for 2021 with uncertainty ranges can be used (lower and upper bound are 90% uncertainty intervals from the model). There is little research on the community to institutional stillbirth ratio (partly because community level stillbirth reporting is more uncertain) but it is likely that the ratios are lower than for maternal mortality, as institutional mortality levels are much higher for stillbirth rates than for MMR. A range of 0.5-2.0 may be used for the estimation of the level of completeness of facility reporting.
17
Maternal death is defined as any cause related to or aggravated by pregnancy or its management (excluding accidental or incidental causes) during pregnancy and childbirth or within 42 days of termination of pregnancy, irrespective of the duration and site of the pregnancy↩︎
A baby who dies after 28 weeks of pregnancy, but before or during birth, is classified as a stillbirth. Often the distinction is made between ante-partum (macerated) and intrapartum (fresh) stillbirths.↩︎
It is however good to inspect the data and consider extreme outliers (more than 3 standard deviations from the annual, or more than 5 times the median absolute deviation – see data quality section.↩︎
The assumptions on the range of ratios for community to institutional MMR were selected based on studies that measured both institutional and population mortality estimates (or had information about the percent of all maternal deaths that occurred at health facilities and the percent of deliveries that took place at health facilities.↩︎
An important factor affecting MMR estimates from health facilities, especially if the data are gathered through MPDSR, is that many deaths occur outside of the maternity ward (upon re-admission). If the DHIS2 is based on the reporting of all cause-specific deaths in health facilities, and the maternal death is correctly classified, this is not an issue.↩︎